Test- FTSE 100 Kicks Off August on a High as BP and Senior Lead Market Momentum
$11
10 Oct 2025, 13:13
Neutral
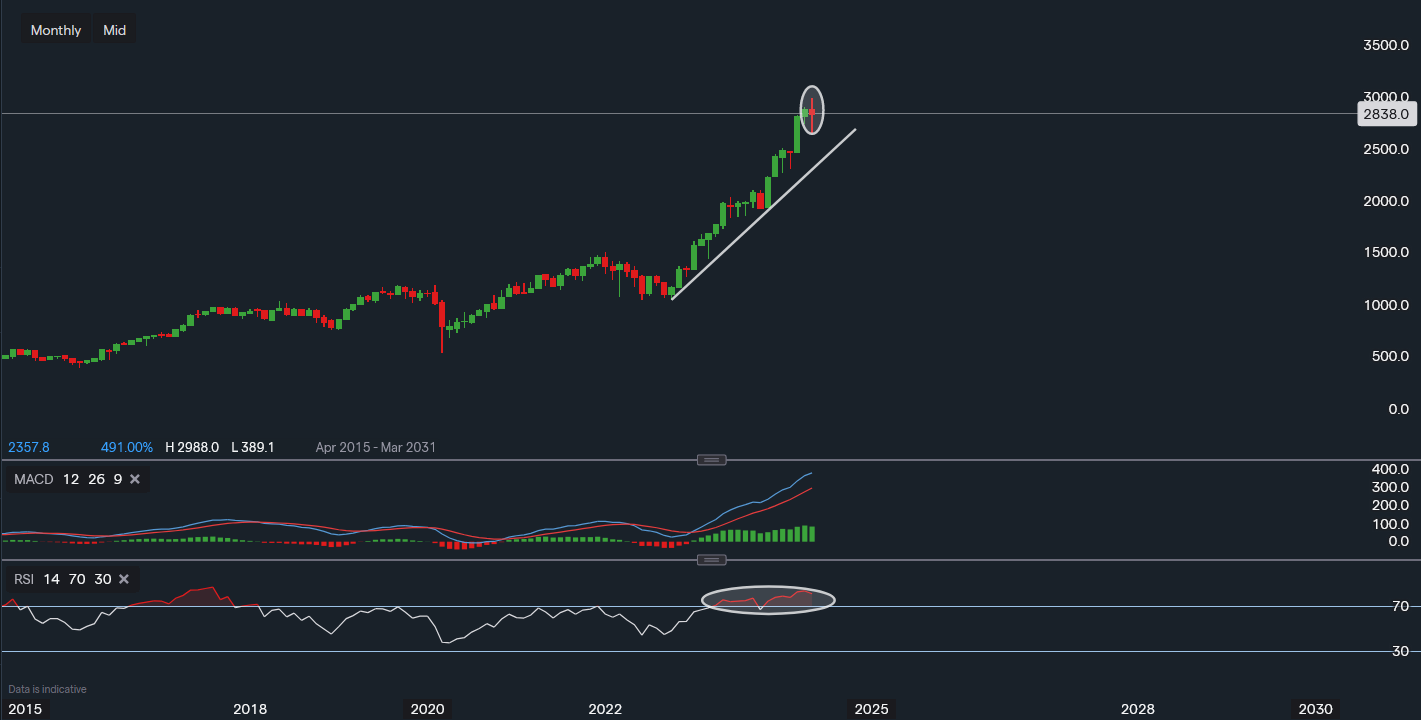
Chart & Data from IG
Taking a look at 3i Group after its 163% rally since October 2022, a very steep increase can sometimes lead to major profit-taking. Although, not necessarily the case at all times. Currently, the stock is trading at around 28.38p. The monthly timeframe suggests that the stock is fair close to its peak overbought conditions, causing some concerns. The MACD is still very positive and showing no signs of stalling, however, the RSI is reading 80. Historically, every time the RSI reached a reading of 80+, a sell-off of some sort has occurred. Therefore, caution should now be the priority. The monthly candlestick seems like it may be forming a star doji, though this will be more clear at the end of the month when it closes. The support reads 26.50p, a fall below is likely to lead to a pullback towards trendline support (25.61p). A break and close below the trendline would shift the focus to 23.07 and maybe even as low as 20.00p. However, this would have to be analysed at the time of the event.

Tradable assets:
Min.Deposit:
Max Leverage:
FCA:

Rating:


