Test- FTSE 100 Kicks Off August on a High as BP and Senior Lead Market Momentum
$11
10 Oct 2025, 13:13

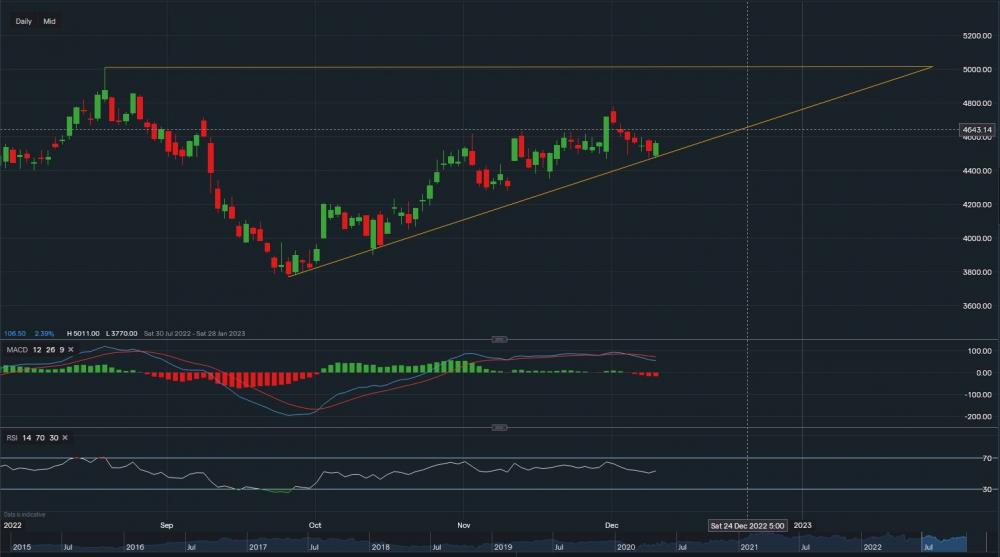
ABM - Chart & Data from IG

Overview
The American company ABM Industries Inc. is a provider of facility management services. Morris Rosenberg started ABM in 1909 as a one-man window-washing operation in San Francisco, California. The organisation has more than 140,000 employees as of 2019 and operates in more than 350 offices across the globe. New York serves as the location of its corporate headquarters.
Financials
Comparing ABM’s financials for the year 2021 against 2020. In 2021, the revenue rose to $6.2bn from $5.9bn and gross profit rose $970m from $830m. Even though EBITDA fell by $69m compared to the previous year, net income after tax and expenses still came in at a total of $126m. A huge gain against $0.3m in 2020. As a result, earnings per share came in at $1.87 for the year. Furthermore, total liabilities saw a rise of $550m but the total assets of the company also saw a rise, this rise totalled $660m YoY. Hence, offsetting the rise in liabilities. The company’s cash-on-hand value fell drastically by $332, nevertheless, the value of the total equity still rose to $1.6bn in 2021 from $1.5bn in 2020.
Technicals
From a technical outlook, ABM’s shares are currently trading around $45.60 a share. It seems like the stock may be forming an ascending triangle, with resistance sitting at $46.16 then at $47.17 then at $47.77. A break above $47.77 could see ABM’s share price hike towards the key level at $50.11, which was last seen on the 19th of August. The $50.11 price level also corresponds with the upper trendline of the triangle. On the other hand, towards the downside, support currently sits at $45.03 then at $44.93 then at $44.74 (corresponds with the ascending trendline of the triangle). A break below these levels may see ABM’s stock price fall towards the price range of $42-$43. Looking at the technical indicators, MACD is slightly negative but RSI is positive as it reads 53.
Summary
Based on the financials of ABM, revenue and gross profit continue to steadily grow. Even though EBITDA did see a chunky decline, net income still came in at $126m higher than in the prior year. As a result, the company managed to report a positive EPS. Cash on hand pile also took a big hit, however, total assets outweigh the liabilities while increasing ever so slightly year-on-year. This gradual increase continues to push the total equity higher, which is always a positive for any business. Looking at the technicals, indicators are currently mixed and do not provide a confirmative direction. Although, the stock has been in an uptrend since the 28th of September and support seems to be established below. Based on past trends, the share price dips towards the support line before bouncing higher. Though a slip below the trendline could see a sharp decline. The company is due to report some earnings tomorrow, a positive report may provide some momentum nudging it higher towards those resistance levels.