Test- FTSE 100 Kicks Off August on a High as BP and Senior Lead Market Momentum
$11
10 Oct 2025, 13:13
Neutral
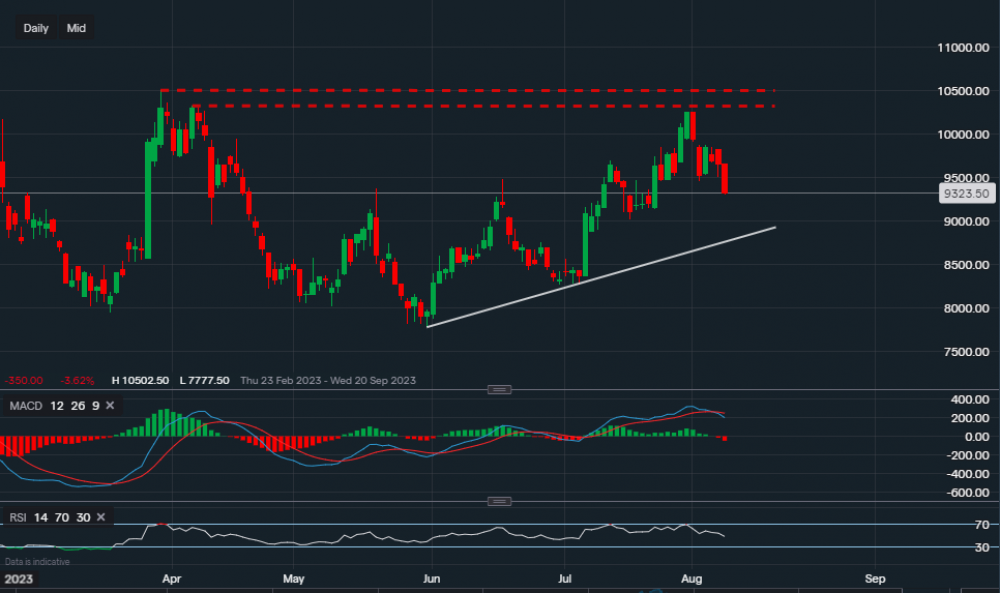
Chart & Data from IG
Alibaba’s stock is trading at around $93.23 a share just after the US open. We can see the price tried to test the resistance level of $103.23 across July 31st and 1st of August, but clearly ran out of steam and soon began retracing lower. It has now surpassed support of $94.56 and heading towards support of $90.16. Depending on the earnings due on Thursday, it may not need to reach $90.16. A positive report may lead to a U-turn, in that case, we would then look at resistance at $94.86 then $96.99. A move above $96.99 could re-spark the momentum for a second attempt on the key resistance zone highlighted by the dotted trendlines. This resistance zone is key for Alibaba because any consolidation within would increase the likelihood of a break higher. Looking at the technical indicators, MACD has just turned negative and the RSI has started to falter, as it now reads 48. However, this is not necessarily an indication that this stock has now entered a longer-term bearish trend. We can see that the price has been setting higher highs and higher lows along the ascending trendline, keeping the longer-term bias bullish for the time being.
Based on today’s analysis:
Short-term: Yes – more downside possible
Longer-term: Remains bullish, unless clear signs of weakness in support below.

Tradable assets:
Min.Deposit:
Max Leverage:
FCA:

Rating:


