Test- FTSE 100 Kicks Off August on a High as BP and Senior Lead Market Momentum
$11
10 Oct 2025, 13:13
Neutral
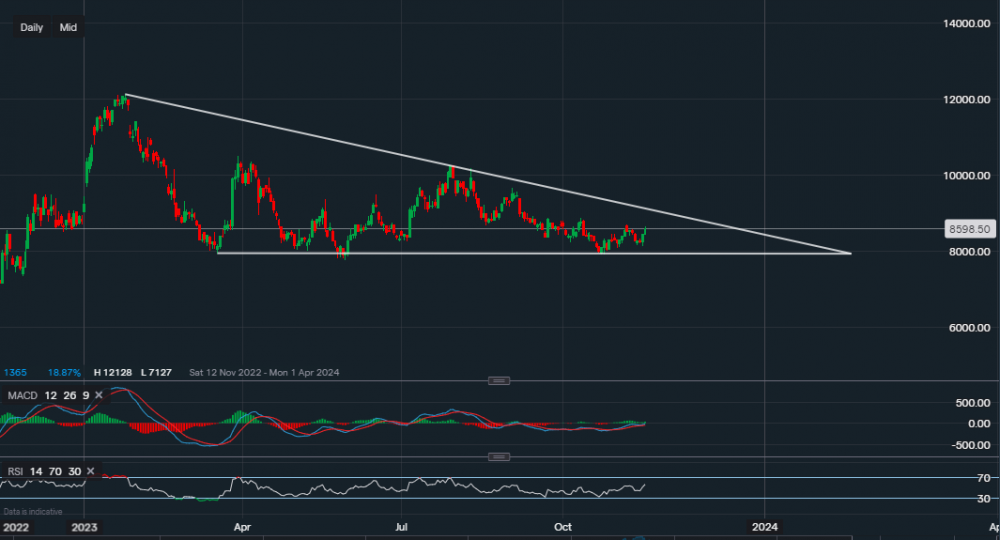
Chart & Data from IG
Taking a look at Alibaba as its stock continues to sit within the downtrend from the start of 2023. Currently, its stock price is trading at around $85.98 a share and the Chinese tech company is expected to report its earnings tomorrow. From a technical viewpoint, we can see that the base remains intact and has been tested on a couple of occasions now since March. After the most recent support test in October, the price is now approaching the resistance of $86.95. A break and close above this level could see a push towards $88.79 and maybe even the trendline resistance of $90.37. Only a break and close above the trendline resistance may suggest that a new bull trend is on the rise. Towards the downside, support sits at $84.12 then at $82.45 and then at $81.26. A move below $81.26 could see another pullback to the trendline support. The technical indicators suggest bullish momentum the MACD remains positive and the RSI has just turned positive, reading 56.

Tradable assets:
Min.Deposit:
Max Leverage:
FCA:

Rating:


