Test- FTSE 100 Kicks Off August on a High as BP and Senior Lead Market Momentum
$11
10 Oct 2025, 13:13
Neutral
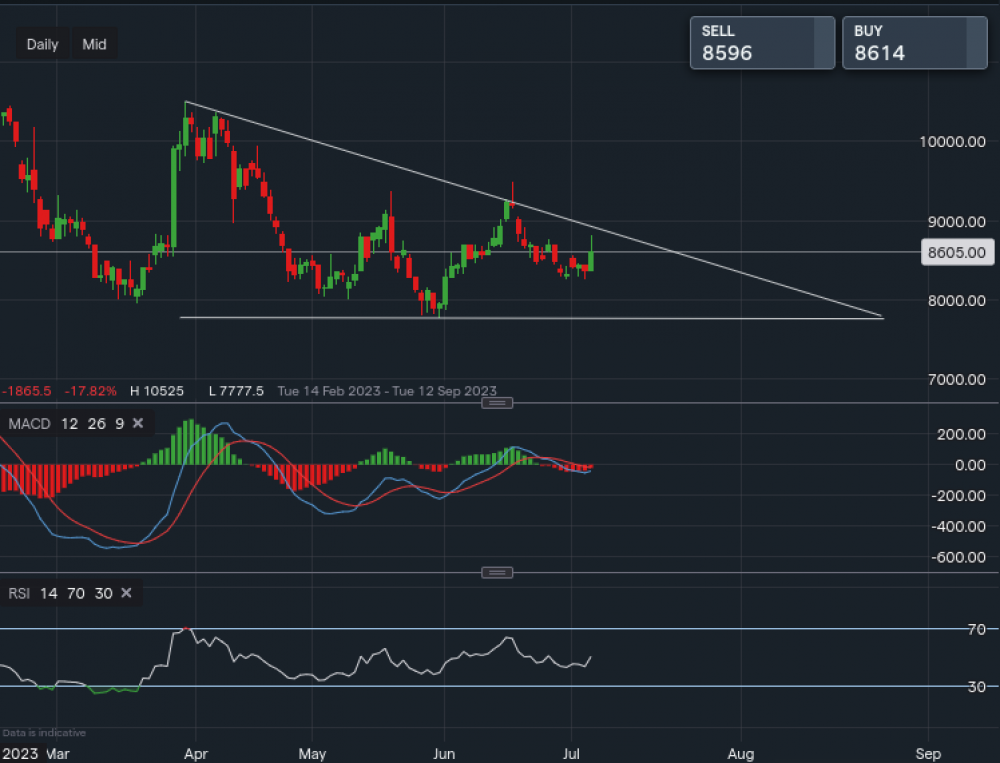
Chart & Data from IG
Taking a look at Alibaba’s stock price after the recent news on the company’s AI play. Currently, its share price sits around $86.02 a share. We can see that on the daily interval the price is sort of forming a descending triangle, however, due to this rise the price is now approaching a resistance level and a new support level has been created. The support now sits at $82.67, a break and close below this level could see the price fall lower towards the key support sitting at $77.77. Now let’s take a look at the upside, the first level of resistance is at $86.92 as the price jumped above it on the news but retreated. Though there is still time in today’s session for a close above. If that is the case, we then would look at the resistance sitting along the descending trendline of the triangle. The resistance along the trendline sits at $88.09, a break and close above this level could see the price break out of the triangle and begin a new bullish trend. Although, this is not guaranteed. Looking at the technical indicators, MACD is negative but the volume is lowering and the RSI has now turned neutral.

Tradable assets:
Min.Deposit:
Max Leverage:
FCA:

Rating:


