Test- FTSE 100 Kicks Off August on a High as BP and Senior Lead Market Momentum
$11
10 Oct 2025, 13:13
Neutral
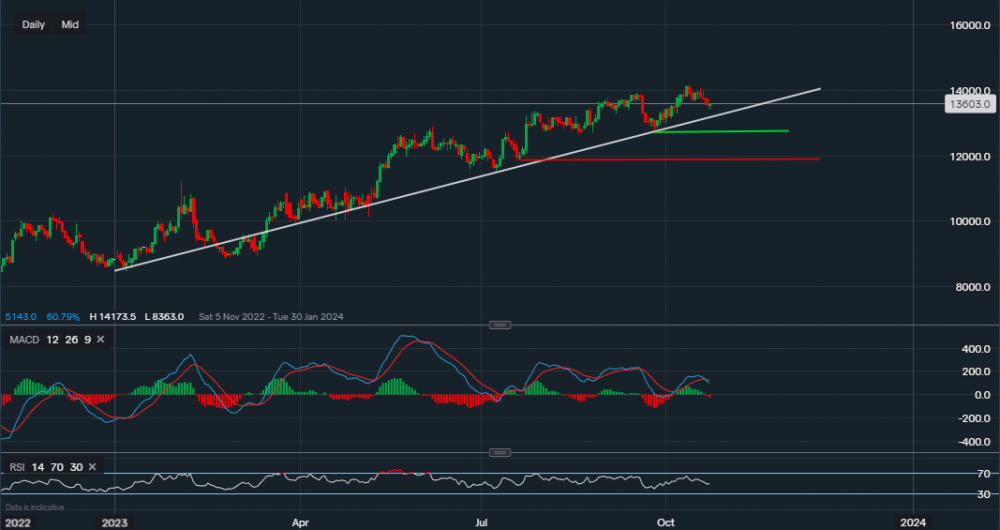
Chart & Data from IG
Alphabet currently trading at around $136.03 a share ahead of its earnings report tomorrow for Q3. Looking at the daily interval, the long-term supportive trendline still sits in place (white) with the stock creating higher highs and higher lows consistently. A break below the trendline support, which reads $131.94, would necessarily suggest that further downside will follow. There is always the possibility of a false break. However, if the support marked by the green trendline ($127.22) is broken, then this would increase the likelihood of further downside. However, in that scenario, there would be additional support sitting at $118.72 which is marked by the red trendline. Towards the upside, resistance sits at $137.85 then at $139.15 and then the high of the year at $141.73. A break and close above $141.73 would increase the likelihood of the continuation of the bullish trend towards the end of the year. Heading over to the technical indicators, we can see that the MACD has turned negative once again, suggesting downside pressure. Nevertheless, since June, we have seen a similar outlook on three separate occasions where the price undergoes a retracement followed by a rise above and beyond. This is a way of the market enticing bears to take shorts before continuing higher, so-called ‘bull-trap’. The RSI is currently neutral as it reads 50.

Tradable assets:
Min.Deposit:
Max Leverage:
FCA:

Rating:


