Test- FTSE 100 Kicks Off August on a High as BP and Senior Lead Market Momentum
$11
10 Oct 2025, 13:13

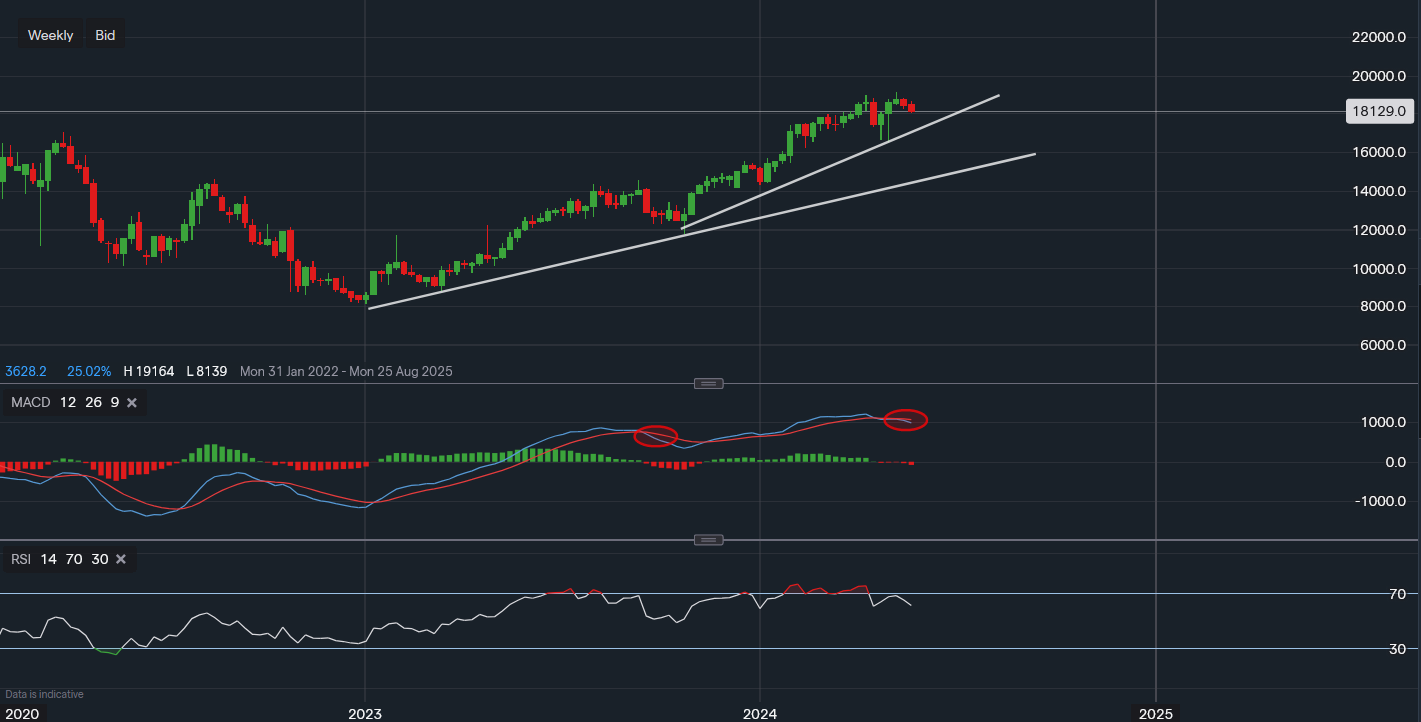
Chart & Data from IG

Taking a look at Amazon as it is struggling to overcome the resistance of $191.64. We can see that its stock price has declined over the past couple of weeks, perhaps heading towards trendline support. Currently, its shares are trading at around $181.29 a share. The trendline support on the weekly chart reads $172.33, a dip below could lead to a slide towards $166.40 in order to test that April low. The key resistance point here is the area of $188-$191, if the bulls manage to break past this point then they may pave the way towards the $200 mark. However, it’s important to note that the technical indicators are somewhat starting to falter. The MACD has crossed below its moving average and the RSI is also on a decline. This could result in a short-term pullback before the price manages to consolidate. Although, this is not guaranteed.