Test- FTSE 100 Kicks Off August on a High as BP and Senior Lead Market Momentum
$11
10 Oct 2025, 13:13
Neutral
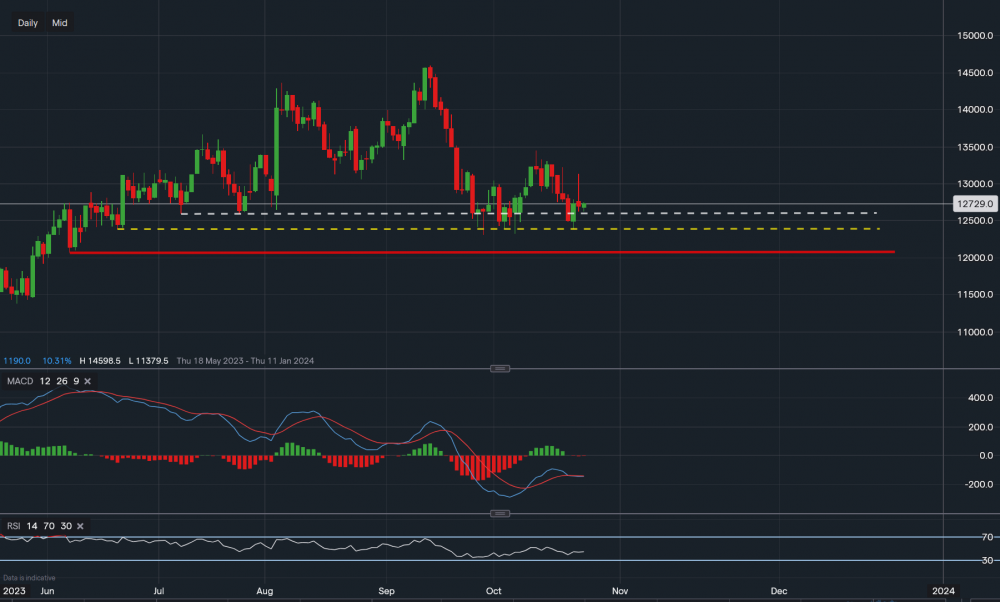
Chart & Data from IG
Taking a look at Amazon as some of the ‘big tech’ have already reported their earnings, so far, mixed outlooks. Currently, its shares are trading at around $127.29 a share with the price hovering just above the support of $125.91 (white trendline). A break below this support would need to then re-test the support of $123.86 (yellow) as we can see this level has demonstrated resilience, so far. A break and close below $123.86 would be a bearish indication with a possible move towards the following support of $120.64 (red). Towards the upside, resistance sits at $128.82 and then at $131.31 (yesterday’s high). After reaching $131.31 in yesterday’s session and being up over 2% on the day, Amazon’s stock soon fell and closed the session down around 1.5%. Therefore, a move above this resistance may see an extension towards $134.47 and perhaps even beyond. Looking at the indicators, they are pretty flat with no clear direction. The MACD is flat and the RSI is actually slightly negative as it reads 44.

Tradable assets:
Min.Deposit:
Max Leverage:
FCA:

Rating:


