Test- FTSE 100 Kicks Off August on a High as BP and Senior Lead Market Momentum
$11
10 Oct 2025, 13:13
Neutral
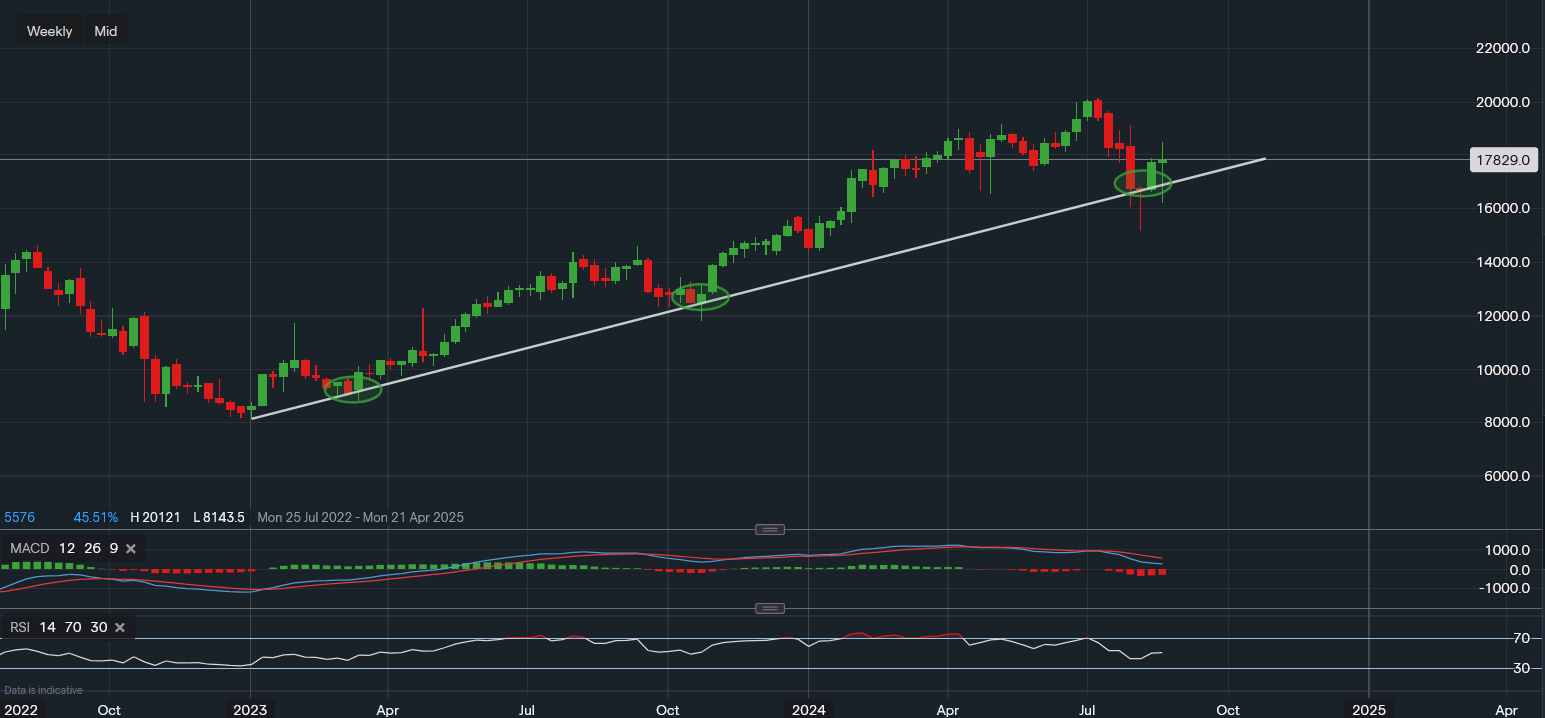
Chart & Data from IG
The trendline dating back to January of 2023 has thus far proven its resilience for Amazon, with buyers rushing in once again after a double-digit decline. Similar to the period between August and October of last year. With the share price now rising to around $178.29 a share after falling to as low as $151.61, investors and traders are still torn as to whether the consolidation stage is underway or whether volatility may resume. Hence, the support and resistance levels will be closely watched heading into September, which historically speaking, is one of the worst periods for the stock market as a whole. Towards the upside, resistance levels to keep an eye on are $181.77 then $189.78, and then $191.68. Whereas towards the downside, support levels to focus on are $173.88 then trendline support around $167.72, and then August’s low of $151.61. Heading over to the technical indicators, the MACD is arguably negative (strong), but the RSI has edged a little higher as it now reads 50 and out of the bearish territory.

Tradable assets:
Min.Deposit:
Max Leverage:
FCA:

Rating:


