Test- FTSE 100 Kicks Off August on a High as BP and Senior Lead Market Momentum
$11
10 Oct 2025, 13:13
Neutral
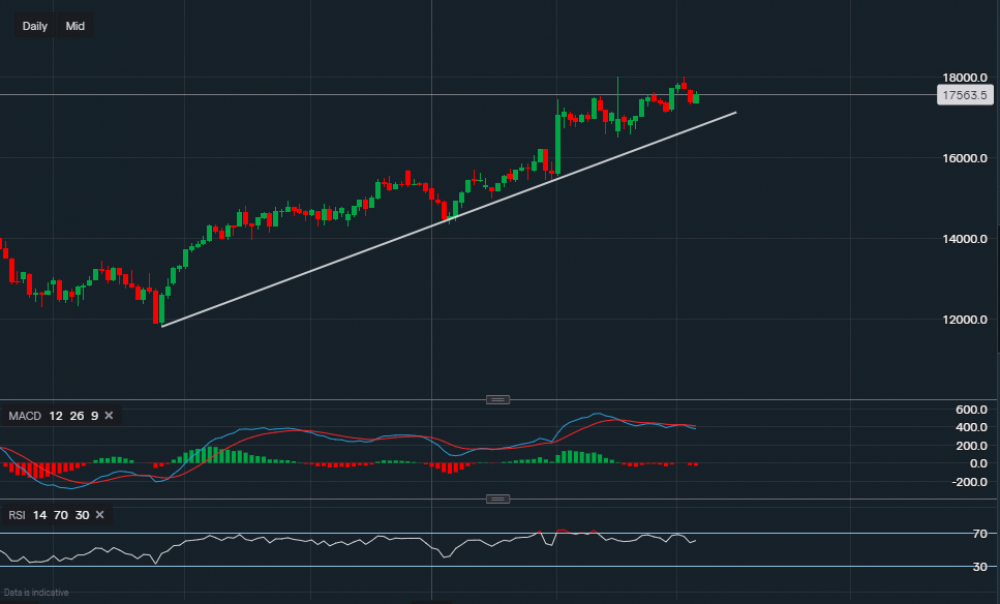
Chart & Data from IG
Amazon continues to trade in a pattern of higher lows followed by higher highs on the daily chart. The firm’s shares are trading at around $175.63 a share, with the most recent resistance now reading $180.11. A move above this resistance would pave the path towards the all-time highs of $185-$186. Support sits at $173.30 then at $171.14, a break below $171.14 could then see a pullback towards trendline support. Or respectively, $167.69. A break and close below the trendline could create some concerns in the near term, potentially increasing the likelihood of a further retracement towards $158-$160. Looking at the technical indicators, we can see that the MACD has actually turned negative on the daily chart, suggesting the selling pressure may have increased as of late. The RSI remains positive as it reads 58, so a fairly mixed view for the time being from the indicators.

Tradable assets:
Min.Deposit:
Max Leverage:
FCA:

Rating:


