Test- FTSE 100 Kicks Off August on a High as BP and Senior Lead Market Momentum
$11
10 Oct 2025, 13:13

Chart & Data from IG

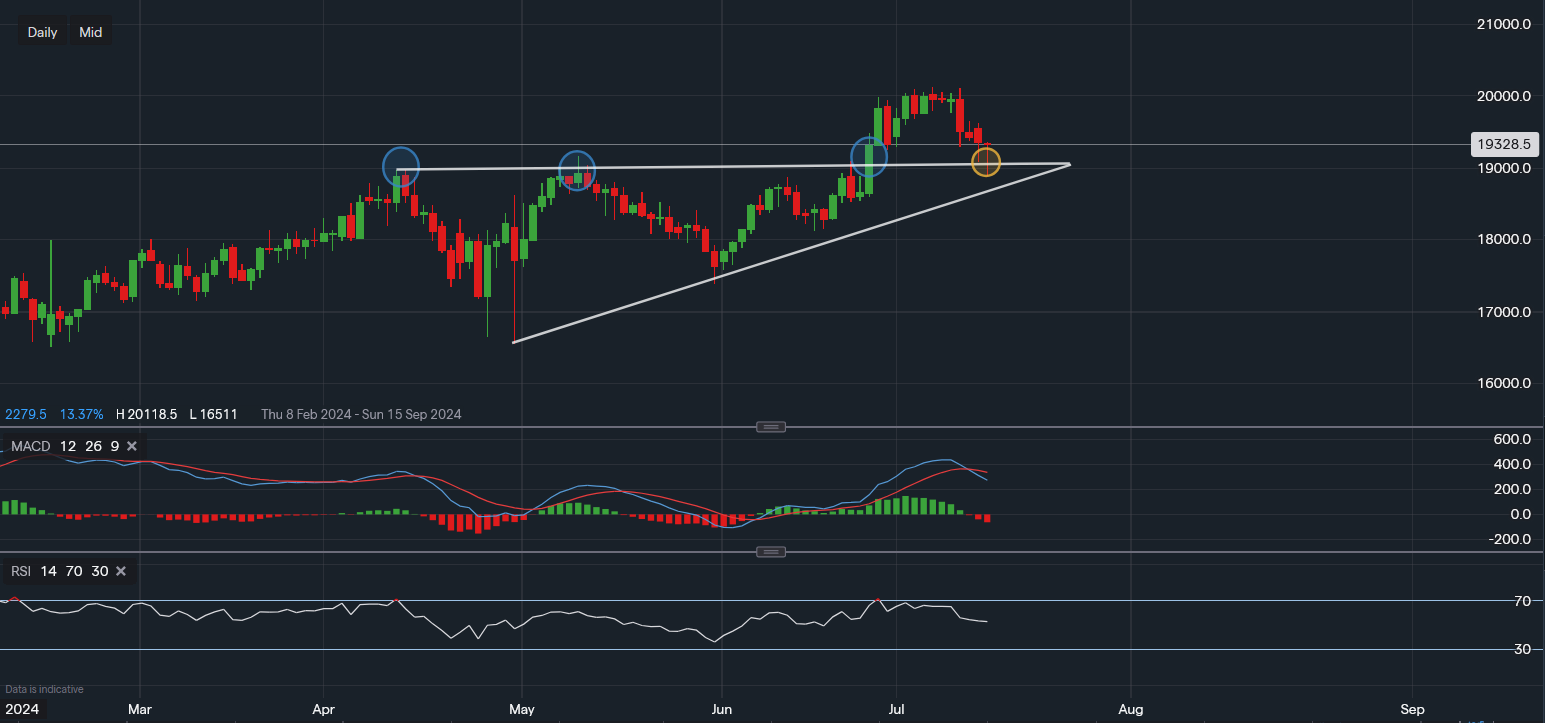
Amazon is testing this resistance to support flip zone after the breakout above the resistance of $190-$191 back in June. After coming across new resistance around $200, the stock has sold off around 4% since and is now trading at around $193.28 a share. The area of $190-$191 should act as the near-term support, if a fall below occurs, investors may then turn to $181-$182. We can see that the technical indicators on the daily chart have faltered slightly as of late, with the MACD now turning negative and the RSI slipping into a neutral stance as it reads 53. This suggests that there is an increased likelihood of selling pressure weighing on the stock in the near term, perhaps with the approaching earnings profit-taking may be taking place as investors want some caution. If there is some consolidation around $190-$191, this may lead to another leg higher back to $200 and beyond. This will be more clear following the earnings call as this could be the new catalyst.