Test- FTSE 100 Kicks Off August on a High as BP and Senior Lead Market Momentum
$11
10 Oct 2025, 13:13
Neutral
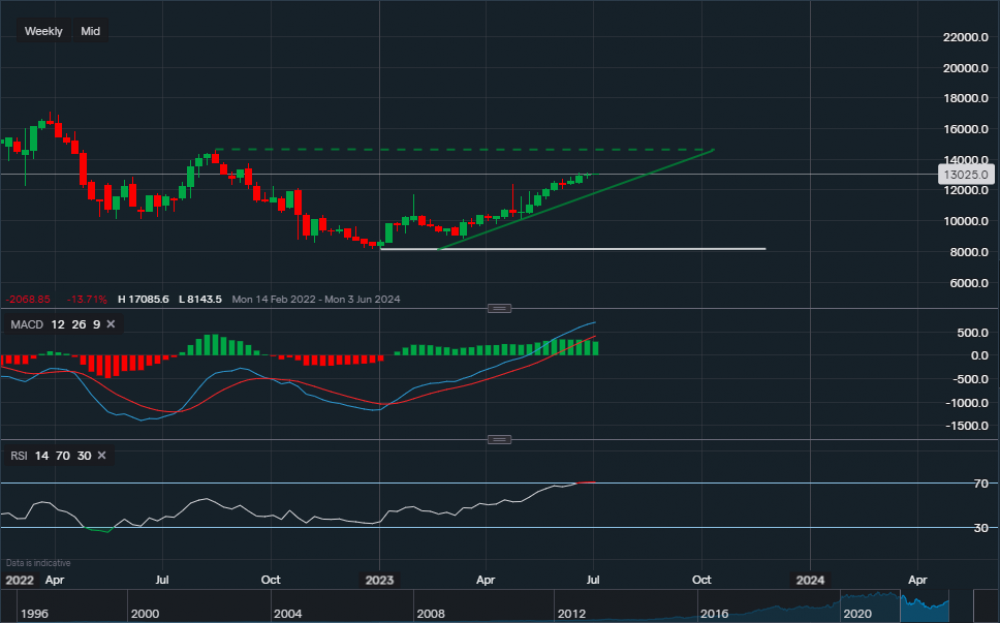
Chart & Data from IG
Amazon grinding higher, comfortably rising since the start of May after its push upwards. From a technical aspect, currently trading at around $130.25 a share. Support is well established below along the ascending green trendline at $121.68. A break and close below this trendline could see the price move lower towards the next support level at $105.35, though the bias for the time being remains bullish. Hence, towards the upside, the first resistance level sits at $137.78 followed by the key resistance at $146.56 (green dotted trendline). A break and close above this trendline could open the path for more upside, with the target then around $160-$165, although this outlook is more likely in the longer term. Over to the technical indicators, MACD is strongly positive and so is the RSI as it reads 71.
Note: The RSI is currently suggesting that the stock is ‘overbought’, therefore, a slight retracement could occur before any moves higher.

Tradable assets:
Min.Deposit:
Max Leverage:
FCA:

Rating:


