Test- FTSE 100 Kicks Off August on a High as BP and Senior Lead Market Momentum
$11
10 Oct 2025, 13:13
Neutral
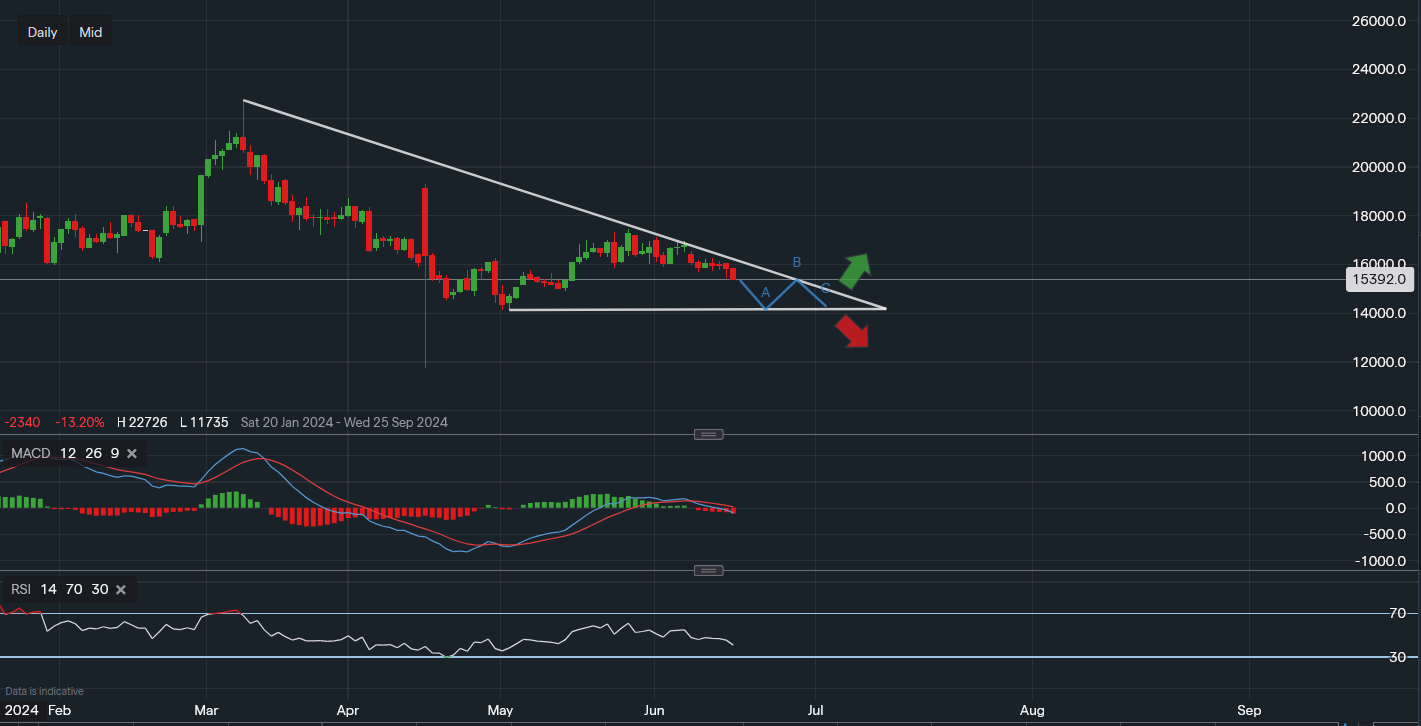
Chart & Data from IG
AMD having a hard time compared to its peers in the semiconductor industry. Currently, its stock is trading at around $153.92 a share, down 32% from its all-time high back in March. Looking at the daily chart, we can see the resistance between $169-$174 was overpowering, leading to the recent slider lower once again. The clear point of support to look out for is the level of $141.116, which should act as a major support level in the short-mid term. A break below would likely spark a fresh sell-off spree, perhaps sending the price toward December lows. Although, the stock does also have support at $148.80 which may assist in some consolidation in the near term. The resistance above that needs tackling is along the descending trendline, at present, reading $158.87. However, we may see a price squeeze going into Q3 before a definite move is established in either direction. The squeeze would see $141-$149 as the price range. The technical indicators on the daily chart do not offer an incentive for the bulls, the MACD has turned negative once again and the falters as it now reads 40.

Tradable assets:
Min.Deposit:
Max Leverage:
FCA:

Rating:


