Test- FTSE 100 Kicks Off August on a High as BP and Senior Lead Market Momentum
$11
10 Oct 2025, 13:13
Neutral
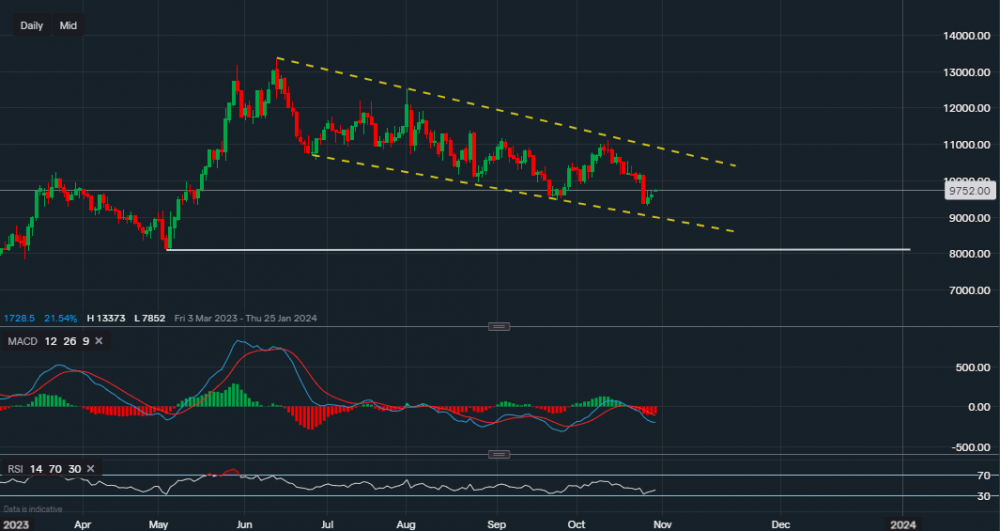
Chart & Data from IG
AMD’s stock currently trading at around $97.52 a share. We can see that its price has been trading within the downward channel drawn on the chart. This pattern began on the 13th of June after the price tried pushing higher but closed below the opening level of the prior day. It has fallen 25% since. The price is trading in the lower end of the channel, it may perhaps try and head towards the upper half testing the resistance of $104.96 followed by the trendline resistance of $106.93. A break and close above $106.93 could be an indication that the downtrend has come to an end and the longer-term bullish trend has resumed. On the other hand, towards the downside, support sits at $93.12 and then at $89.65 (lower trendline of the channel). A break and close below $89.65 would be a strong indication that more downside is to follow with a potential fall towards the major support of $81.00 (white trendline). The technical indicators boost the bearish bias for the time being as both are negative, with the RSI reading 41.

Tradable assets:
Min.Deposit:
Max Leverage:
FCA:

Rating:


