Test- FTSE 100 Kicks Off August on a High as BP and Senior Lead Market Momentum
$11
10 Oct 2025, 13:13
Neutral
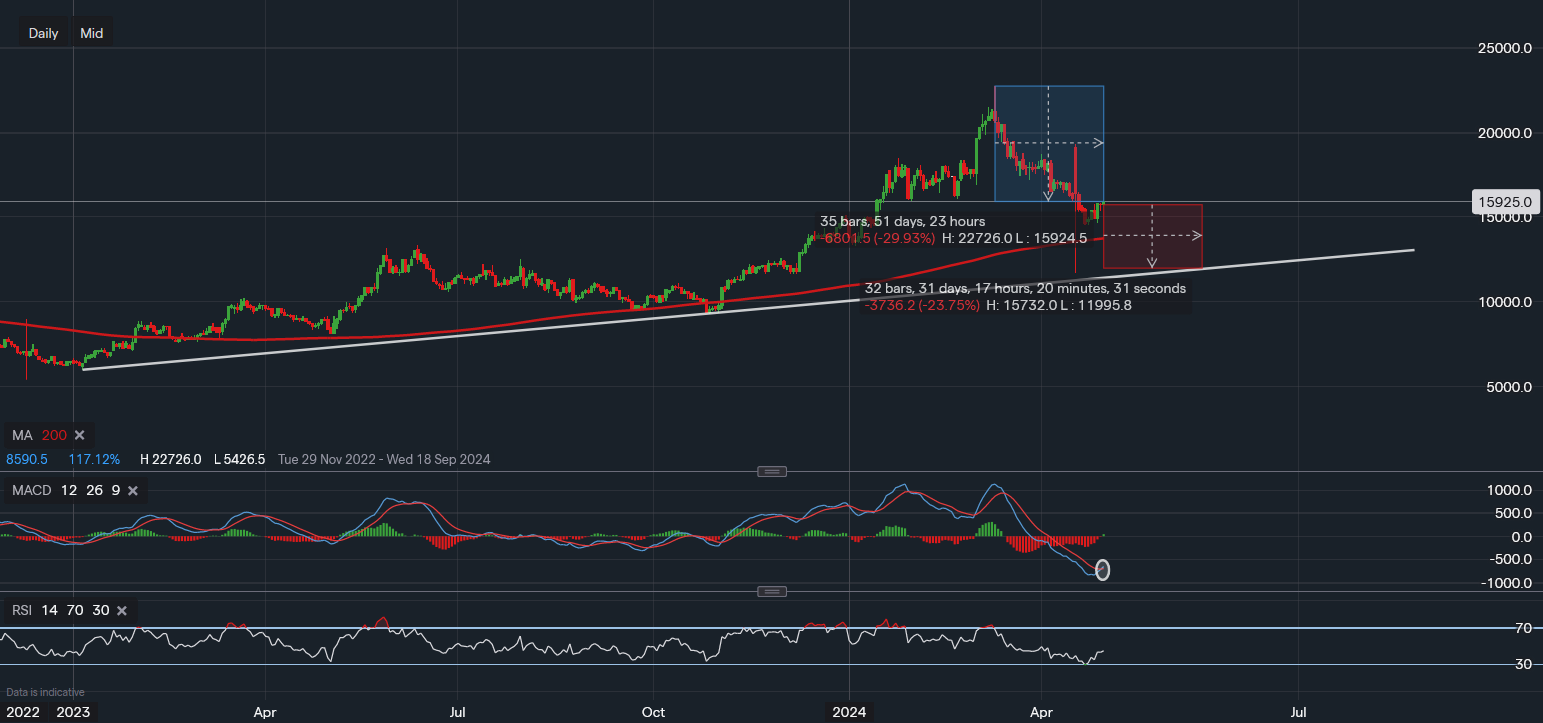
Chart & Data from IG
AMD’s share price is now down almost 30% since its all-time high of $227.26. Currently, its shares are trading at around $159.25 a share and investors are hoping that its earnings report may re-spark some optimism going into the next quarter. We can see on the daily timeframe that the recent sell-off has forced the price closer to its 200-day moving average. The 200MA currently reads $137.28, a disappointing earnings release may be the catalyst for a further decline towards the 200MA. Failure to consolidate along the 200MA may even lead to a sell-off toward the longer-term trendline support. Though this would result in another decline of 20-24%, taking the price to around $120-$125. We can see the stock has found some support at $135.63, which will act as the primary support going into earnings. On the other hand, the resistance reads $164.43. A break and close above this level would then allow investors to eye up the area of $170-$180. Looking at the technical indicators, there are some noticeable factors. The MACD is turning positive in the pre-market session, if the stock can close the US session on the positive it creates a better set-up for a bounce higher. The RSI reads 44, which is technically still just negative but almost in a neutral position. However, it is rather flat suggesting the momentum is stalled.

Tradable assets:
Min.Deposit:
Max Leverage:
FCA:

Rating:


