Test- FTSE 100 Kicks Off August on a High as BP and Senior Lead Market Momentum
$11
10 Oct 2025, 13:13
Neutral
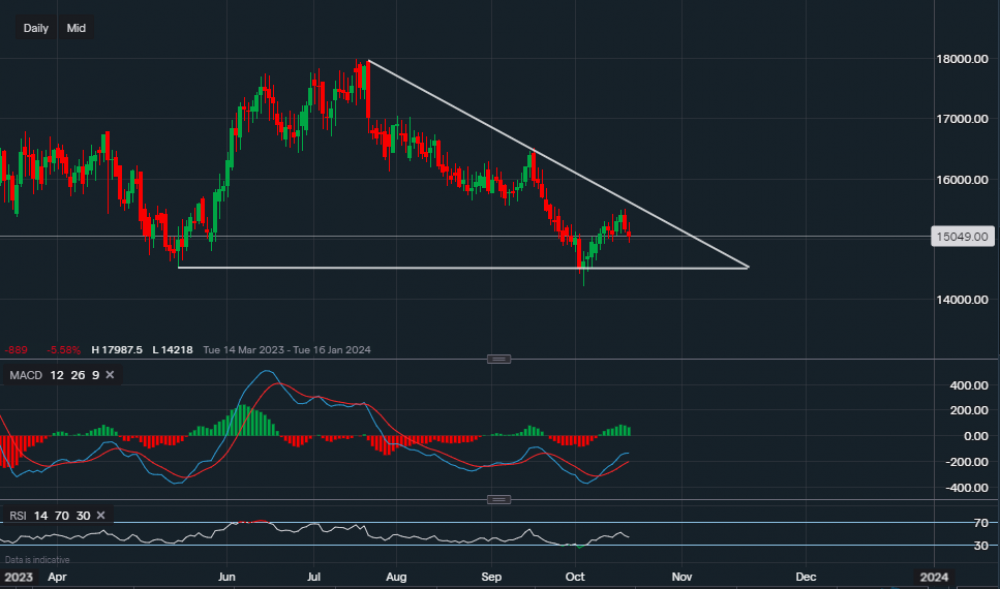
Chart & Data from IG
American Express still moving in a bearish trend which began back in July, currently trading at around $150.49 a share. After the correction towards the descending trendline of the triangle, it seems like the trend may resume lower. Support sits at $149.46, a break below could see the price slide lower once again towards the lower trendline of the triangle. However, the company is expected to report quarterly earnings tomorrow. The earnings outcome will certainly help with the near-term direction for this stock. The tough resistance point sits at $155.61 (along the trendline), a break above it would create a potential opportunity a move towards $160. The technical indicators portray a mixed outlook for the near term as the MACD is positive whereas the RSI is negative. The RSI reads 43.

Tradable assets:
Min.Deposit:
Max Leverage:
FCA:

Rating:


