Test- FTSE 100 Kicks Off August on a High as BP and Senior Lead Market Momentum
$11
10 Oct 2025, 13:13
Neutral
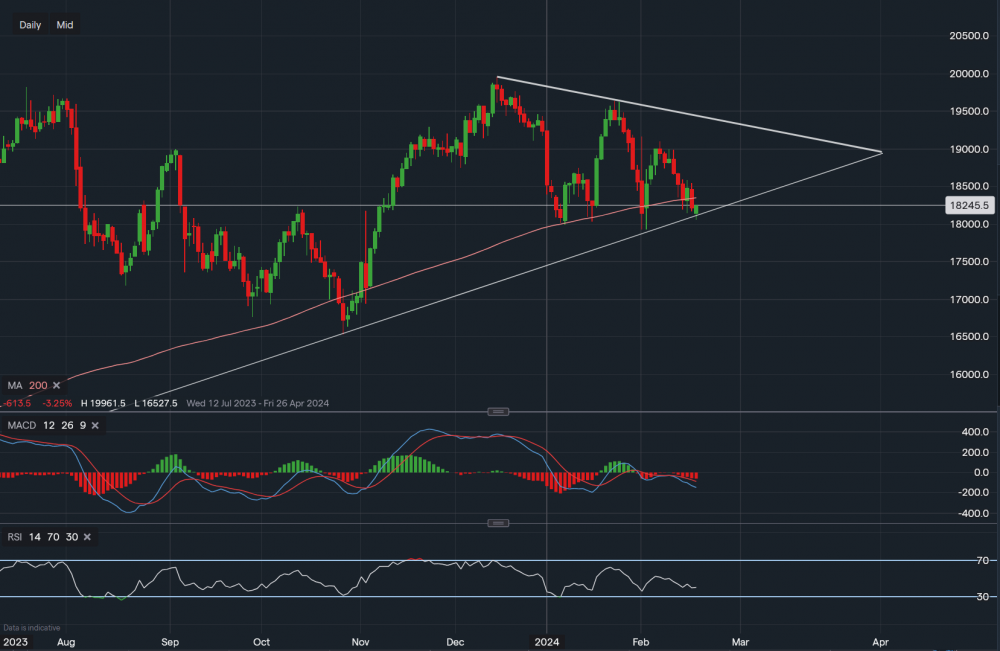
Chart & Data from IG
Apple trying to bounce off this trendline support after breaking through its 200-day moving average. We can see on the daily timeframe that the bearish price movement continues, however, if we see some consolidation along the current level then it would suggest that a possible bounce higher could be likely. Currently, its stock is trading at around $182.45 a share. A break and close below its 200MA would usually be a bearish indication, increasing the likelihood of further downside. Which still could happen. However, sometimes the markets can be deceiving, setting up a bull trap before continuing its longer-term up trend. Therefore, this week will be the decider for the near-term with earnings from Nvidia due tomorrow and also the Fed minutes in the UK evening time. Support along the trendline reads $181.01, which we can see was tested earlier in the all-sessions trade. A break below $181.01 would then also require a break below the support of $179.23 to suggest that further downside is likely. Towards the upside, the resistance is now along the 200MA, which reads $183.47. A close back above the moving average would then shift the focus towards $185.87 and then $187.46. Looking at the technical indicators, they remain negative with the MACD volume still enlarged and the RSI dipping lower as it reads 39.

Tradable assets:
Min.Deposit:
Max Leverage:
FCA:

Rating:


