Test- FTSE 100 Kicks Off August on a High as BP and Senior Lead Market Momentum
$11
10 Oct 2025, 13:13
Neutral
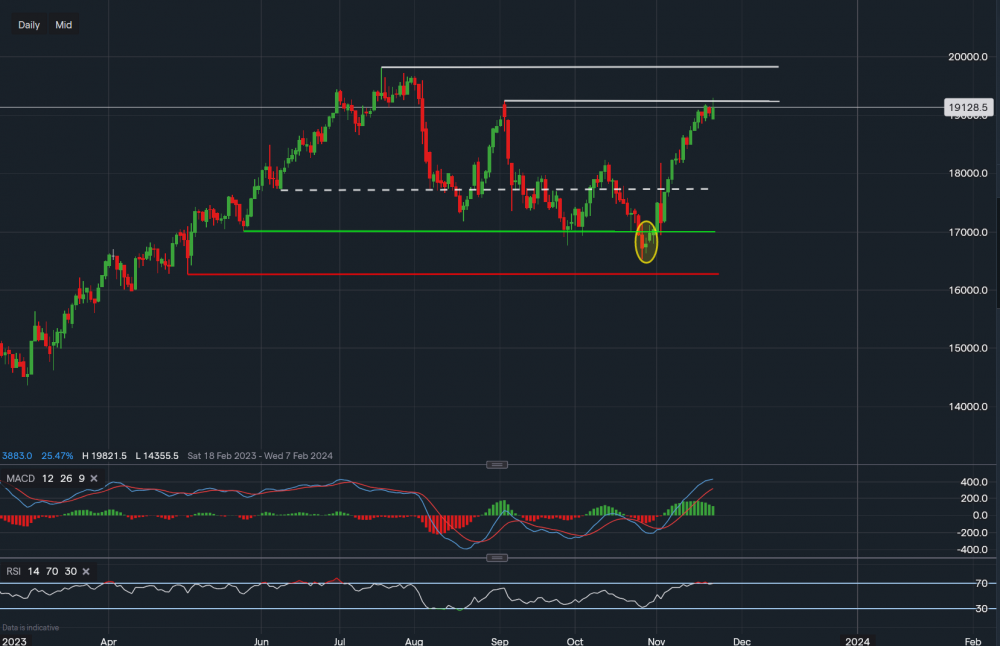
Chart & Data from IG
Apple is currently trading at around $191.28 after its 4-week rally. We can see when the stock underwent the selloff/retracement its price actually dipped below the support of $170.07 (oval), which is what now seems like the new key support level after the correction. Since then, the stock has rallied towards the resistance of $192.48 (lower white trendline in the upper half of the chart). The price did try to move above this resistance in yesterday’s session but soon fell back below, suggesting the resistance is overpowering for now. A break and close above $192.48 would allow the bulls to then look towards $198.21 (an all-time high). A failure to break into the channel in the upper half of the chart may result in a pullback towards the support of $188.96. A break below this support may then see a move lower towards $187.71 and potentially $186.60. However, at this moment in time, the technical indicators continue to point towards a bullish bias. The MACD is positive and so is the RSI as it reads 69. Important to note though, the RSI is hovering just below ‘overbought’ conditions.

Tradable assets:
Min.Deposit:
Max Leverage:
FCA:

Rating:


