Test- FTSE 100 Kicks Off August on a High as BP and Senior Lead Market Momentum
$11
10 Oct 2025, 13:13
Neutral
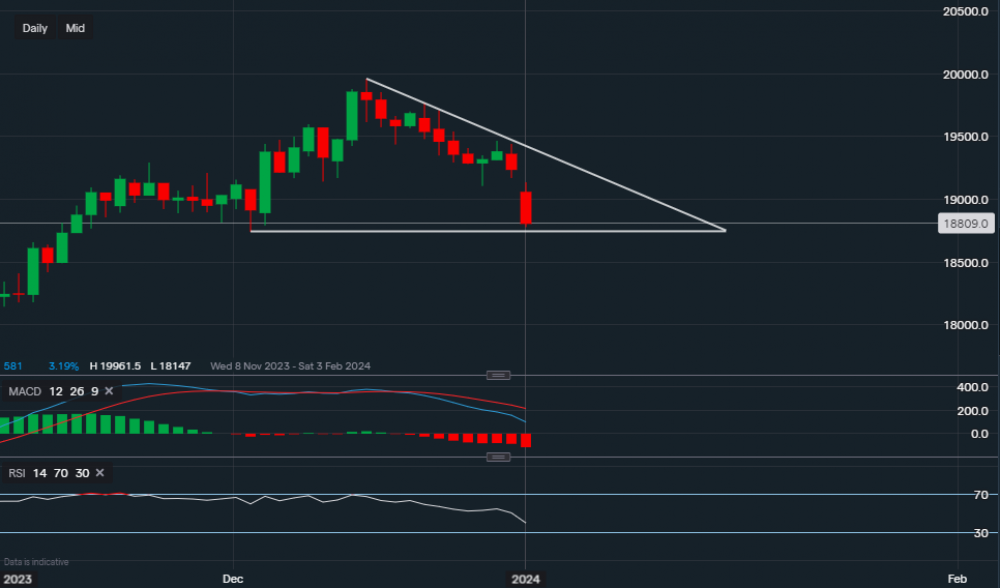
Chart & Data from IG
Taking a look at Apple as it is down 2.3% in pre-market trading. Currently, the tech giant’s shares are trading at around $188.09 a share. Apple’s share price has now been heading in the bearish direction since the 14th of December, with the price now approaching a key support level on the daily interval. The support level in focus here is $187.45 (the lower trendline of the triangle drawn on the chart). A break and close below it could be a hint that January may not be a profit-gaining month for the bulls. This break would force the bulls to look for support around $184 and $182. Any consolidation along the trendline support would create an opportunity for a move towards the descending trendline of the triangle. At this moment in time, the resistance reads $191.11. However, until there are clear signs of consolidation the bias on Apple for the short-term remains bearish. Looking at the technical indicators, the MACD is negative with an enlarged volume. Additionally, the RSI is also negative as it now reads 40 and is on a decline.

Tradable assets:
Min.Deposit:
Max Leverage:
FCA:

Rating:


