Test- FTSE 100 Kicks Off August on a High as BP and Senior Lead Market Momentum
$11
10 Oct 2025, 13:13
Neutral
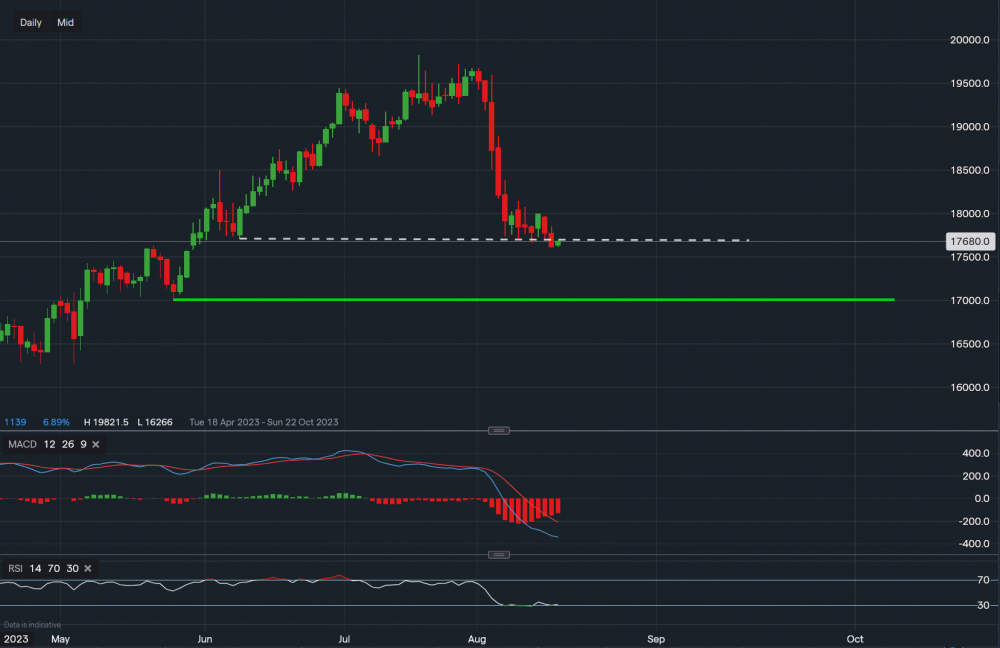
Chart & Data from IG
Apple is trading at around $176.80 a share. From a technical standpoint and based on the daily timeframe, we can see that the price has now broken below the support of $177.10 (dotted trendline). In theory, this would suggest that more downside is forthcoming, however, this is of course not guaranteed as we could see consolidation around current levels followed by a push higher. Since we have broken through the support of $177.10, the next key level sits at $170.07 (green trendline). Unless that level is reached, it would be unreliable to scope lower. The current support is now acting as resistance, therefore a close back above $177.10 may indicate some stability and resilience. Especially as Apple is classed as the ‘bellwether’ of the stock market. Again, it would be unreliable to analyse the upside at this moment in time. Although, if we look at the indicators, MACD remains strongly negative but the RSI is now suggesting oversold conditions. So, a small bounce could occur or as already mentioned some consolidation around the current support/resistance level. Though stocks can be in oversold conditions for long periods investors and traders should be cautious.

Tradable assets:
Min.Deposit:
Max Leverage:
FCA:

Rating:


