Test- FTSE 100 Kicks Off August on a High as BP and Senior Lead Market Momentum
$11
10 Oct 2025, 13:13
Neutral
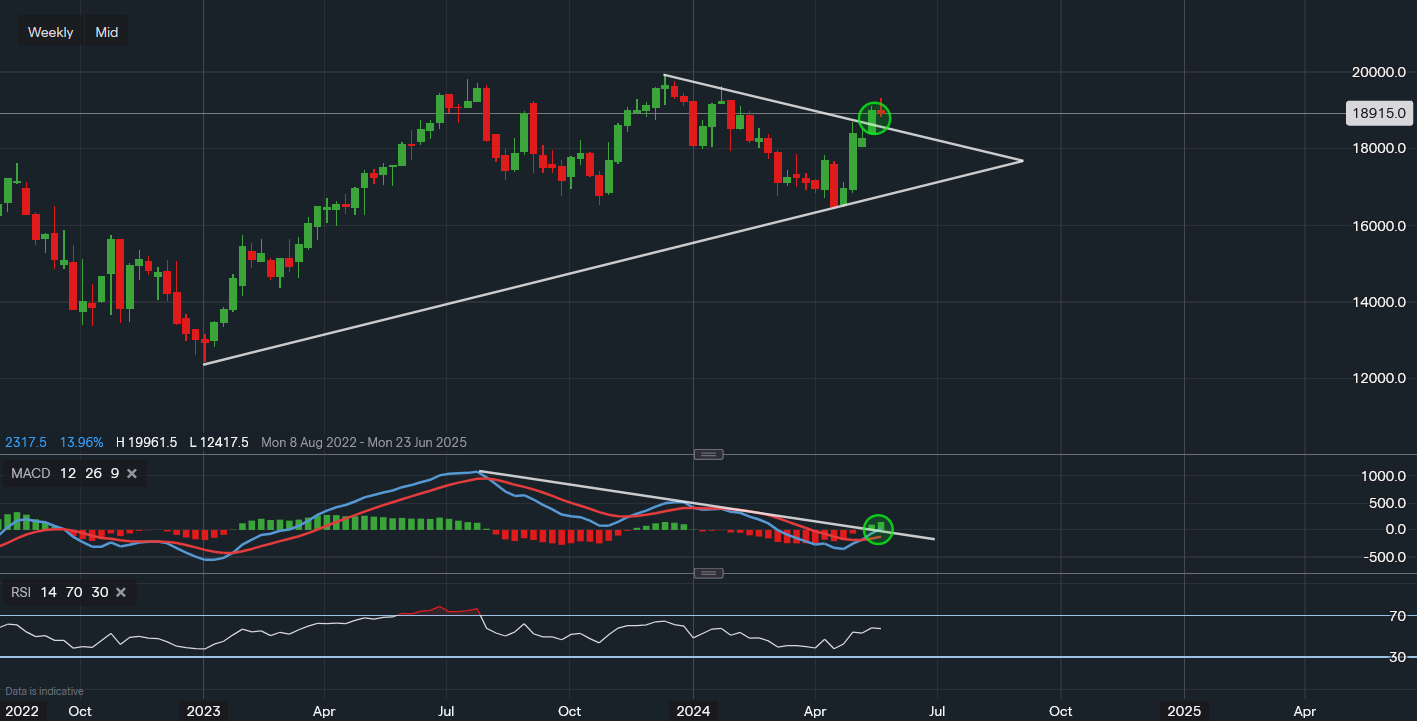
Chart & Data from IG
Apple is showing a possible breakout towards the upside on the weekly chart. After finding support at $164.77, it has recorded three consecutive green weeks since. Though we can see that some profit-taking may now be taking place as this week’s candlestick has failed to move higher for now. Currently, its stock is trading at around $189.15 a share. An engulfing candlestick did appear last week, piercing through the trendline resistance, which tends to be a bullish indication. The price could now be simply heading lower for a re-test of support which was previous resistance. The support is along the descending trendline, reading $185.60. A break below this trendline would see the price re-enter the triangle area. The primary resistance is this week’s high of $193.21. A break and close above would shift the focus toward $196 and then $199 once again. Looking at the technical indicators, they are looking rather positive once again, The MACD has turned positive and is rising and the RSI is just positive as it reads 56.

Tradable assets:
Min.Deposit:
Max Leverage:
FCA:

Rating:


