Test- FTSE 100 Kicks Off August on a High as BP and Senior Lead Market Momentum
$11
10 Oct 2025, 13:13
Neutral
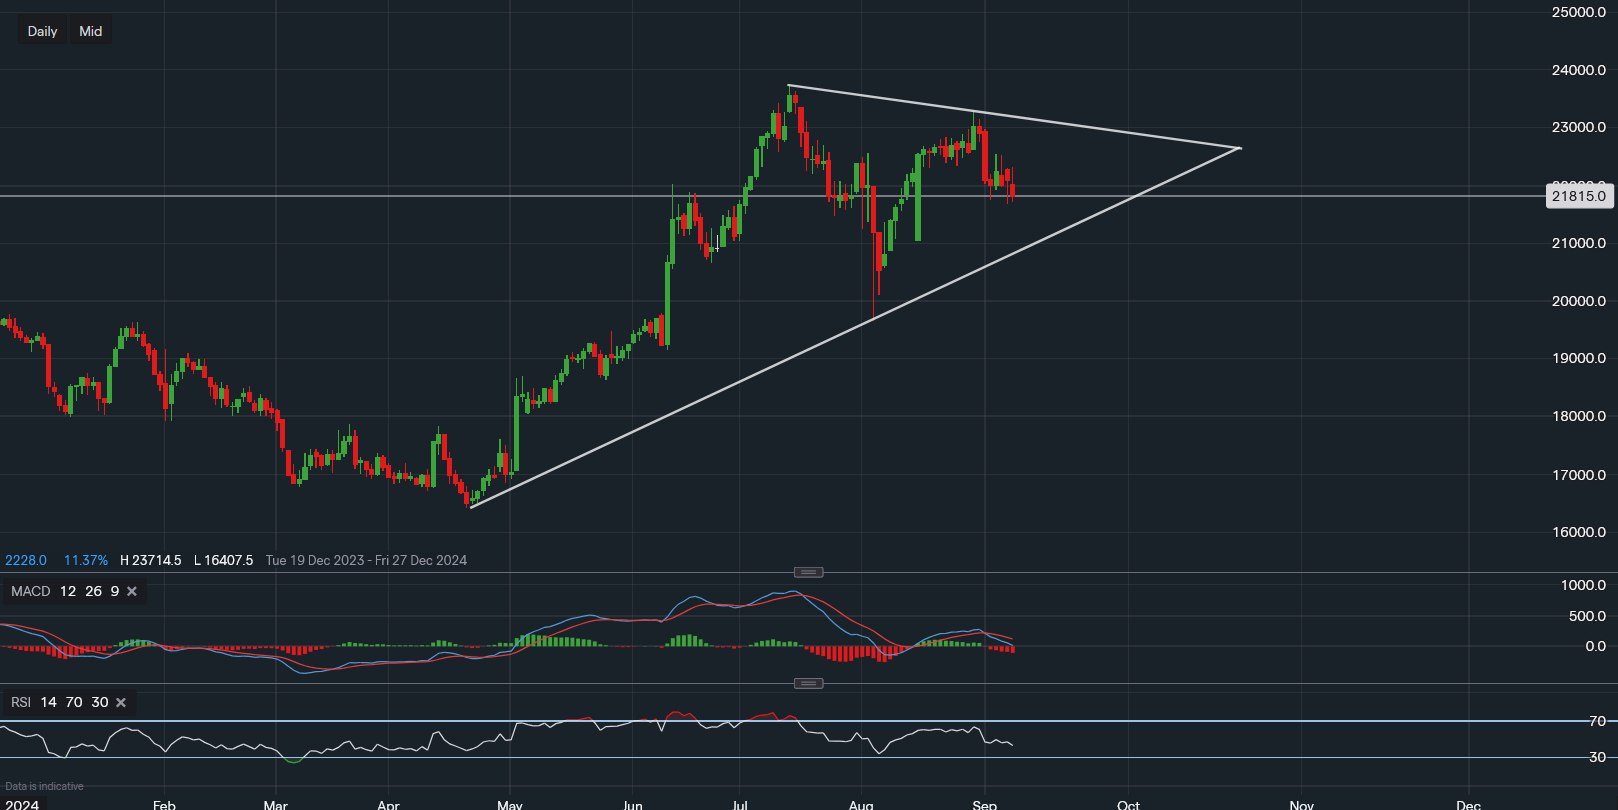
Chart & Data from IG
Taking a look at Apple following the unveil of its iPhone 16 and the abundance of other Apple devices, as well as the news on the Irish tax bill released this morning. Currently, its stock is trading at around $218.15 a share and is down just over 1% in the pre-market. Looking at the daily chart, we can see the price has formed a lower high around $232.91, indicating that a pullback to re-test the trendline support may now be underway, Yesterday's low of $216.74 will be the primary focus in today’s session as a fall below opens up the path for a sell-off towards the supportive trendline. Based on the current positioning, the support along the trendline sits between $209-$210. A break and close below the trendline may even lead to a re-test of the August low, or respectively, $196.53. Towards the upside, investors would first want to see a move above $225.47 and then above the resistance along the upper trendline of around $230-$231. However, only a move above the latest lower high of $232.91 could lead to a re-test of the all-time high ($237.14). The technical indicators are back to bearish positioning as the MACD has crossed below its signal line once again. In addition, the RSI has re-entered bearish terriorty as it reads 43.

Tradable assets:
Min.Deposit:
Max Leverage:
FCA:

Rating:


