Test- FTSE 100 Kicks Off August on a High as BP and Senior Lead Market Momentum
$11
10 Oct 2025, 13:13
Neutral
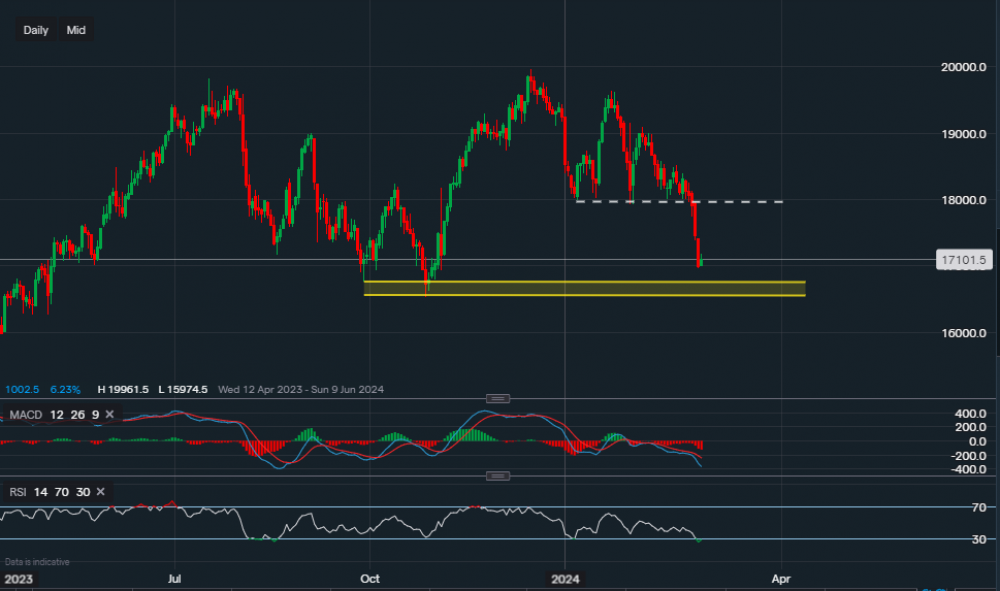
Chart & Data from IG
Taking a look at Apple as the tech giant continues to experience a sell-off. Currently, its stock is trading at around $171.01 a share. Looking at the daily chart, we can see that after crashing through the support base of $180 it is now approaching the next key support area of $165-$167. A break of this support area would then suggest that we could see a further decline towards the area of $150-$155 a share. However, with Apple rumoured to shift its team to work on generative AI rather than car development, and potentially what we’re witnessing is a bull market around us, we could see the buyers starting to rush in from these levels onwards. Nevertheless, it is still too early to determine the mid-term outlook until more data on the US economy is released. It would be unreliable to point out any resistance levels as of now until we see signs of consolidation, the bias currently remains bearish for the near term. Looking at the technical indicators, the MACD is still negative which causes further concerns, and the RSI is now reading 29. Although, it is worth noting that the RSI is now suggesting the stock is oversold once again. On the last two occasions where the RSI was at similar levels, the stock went on to experience a short rally. It Is currently up 0.6% in the pre-market trade.

Tradable assets:
Min.Deposit:
Max Leverage:
FCA:

Rating:


