Test- FTSE 100 Kicks Off August on a High as BP and Senior Lead Market Momentum
$11
10 Oct 2025, 13:13
Neutral
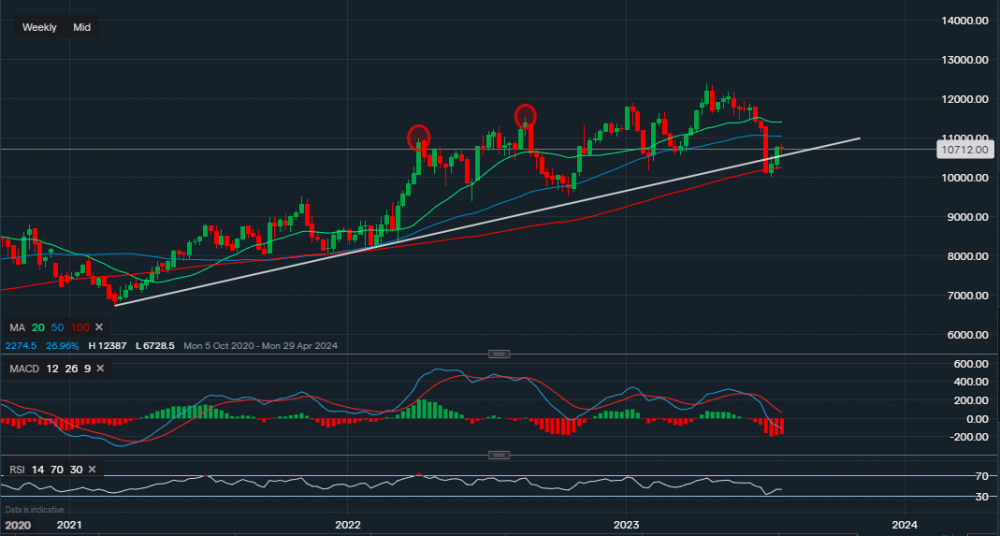
Chart & Data from IG
Taking a look at AstraZenca as in June it experienced some heavy downfall. Currently trading at around 10,712p a share, we can see that on the weekly interval the price has fallen below the supportive trendline (10,476p). However, if we apply the moving averages to the chart, we can actually see that it managed to recover and the following week closed above the 100-day moving average, creating a new level of support (10,210p corresponds with the moving average followed by 10,021p). A move below 10,021 could lead to a fall towards the support of 9,500p. The price is now approaching a level of resistance along the 50-day MA, which currently reads 10,046p. A break above this level would then face the resistance along the 20-day MA, which in turn reads 11,406. These two resistance points are vital in determining whether the stock will continue higher. Over to the technical indicators, MACD is still pretty negative with the RSI just negative as it reads 43.


