Test- FTSE 100 Kicks Off August on a High as BP and Senior Lead Market Momentum
$11
10 Oct 2025, 13:13
Neutral
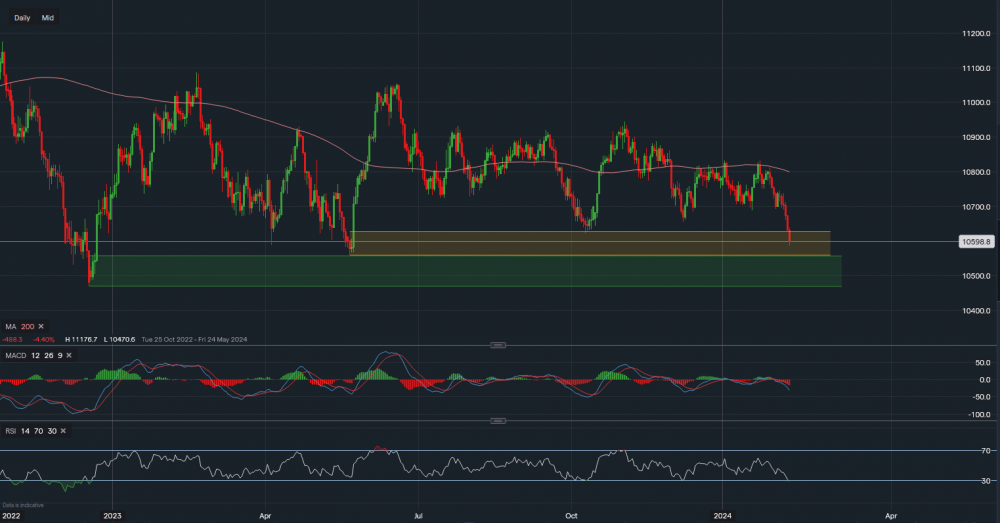
Chart & Data from IG
Taking a look at AUD/NZD as the forex pair has broken through some key support levels in the past couple of days. Currently, the Aussie is trading at around A$1.0598 against the Kiwi and is now approaching the support of A$1.0560, which is the lower end of the yellow chart. A break below this support could see the pair move into the green channel, where the next key support sits at A$1.0470 (lower end of the green). Any signs of consolidation around the support of A$1.0560 could lead to a small bounce higher. Looking at past price action on average, when the pair undergoes a decline of 5-7 straight days, a bounce tends to follow. This of course isn’t guaranteed as we can see on a couple of occasions it has just continued to fall lower. However, upon signs of consolidation around A$1.0598, we would then look towards the resistance of A$1.0588 then A$1.0604 and then A$1.0623 (upper trendline of the yellow channel). Looking at the technical indicators, they continue to portray a bearish outlook. However, if we look at the MACD, when it reaches the levels of -30 to -50 it tends to help support any momentum higher by attracting buyers. It is only at -30 for the time being, so it still has some more room to move lower. Regarding the RSI, it is now suggesting oversold conditions, we can see that every time the RSI has been oversold a bounce has followed.

Tradable assets:
Min.Deposit:
Max Leverage:
FCA:

Rating:


