Test- FTSE 100 Kicks Off August on a High as BP and Senior Lead Market Momentum
$11
10 Oct 2025, 13:13
Neutral
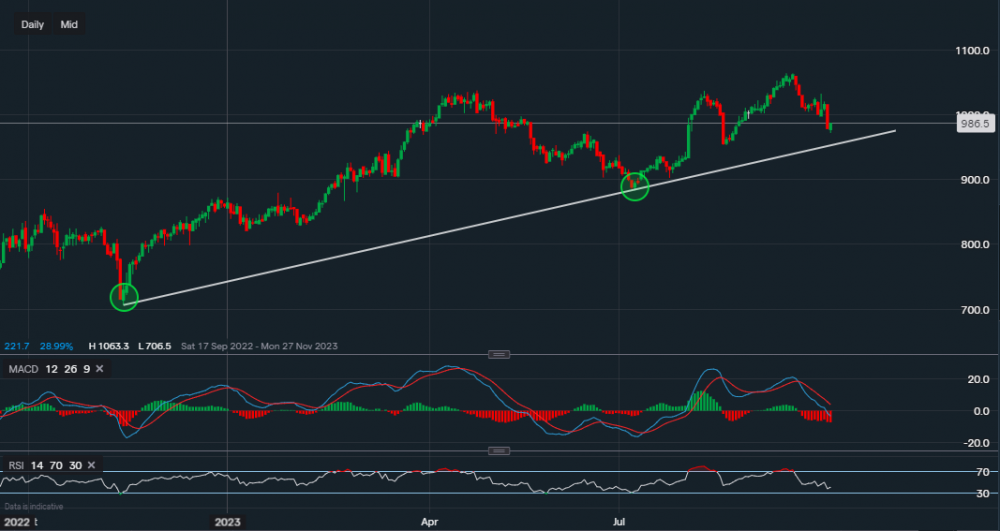
Chart & Data from IG
Taking a look at BAE Systems, its stock is currently trading at around 986p a share, From a technical viewpoint, we can see a long-lasting support trendline, which dates all the way back to November of last year. We can see the price created a key support level at 883p (upper oval), which was followed by a rally higher leading to a new all-time high. The stock is now undergoing some profit-taking, or in other words, a retracement as the longer-term bias remains bullish. The support levels sit at 971p followed by the more important support along the trendline, 955p. A break below the trendline would not necessarily suggest that a reversal trend has occurred, as there are further support levels of 902p and the key level of 883p. On the other hand, if we see consolidation in the area between the current level and the trendline support, we would then look at the resistance above. At this moment in time, the resistance sits at 996p followed by 1,023p. A break above 1,023 could see an extension towards 1,036p and then potentially back up to the all-time high of 1,063p. However, if we look over at the technical indicators, we can see that in the near term, they suggest further bearish price movement. The MACD is negative and still edging lower and the RSI reads 41.

Tradable assets:
Min.Deposit:
Max Leverage:
FCA:

Rating:


