Test- FTSE 100 Kicks Off August on a High as BP and Senior Lead Market Momentum
$11
10 Oct 2025, 13:13
Neutral
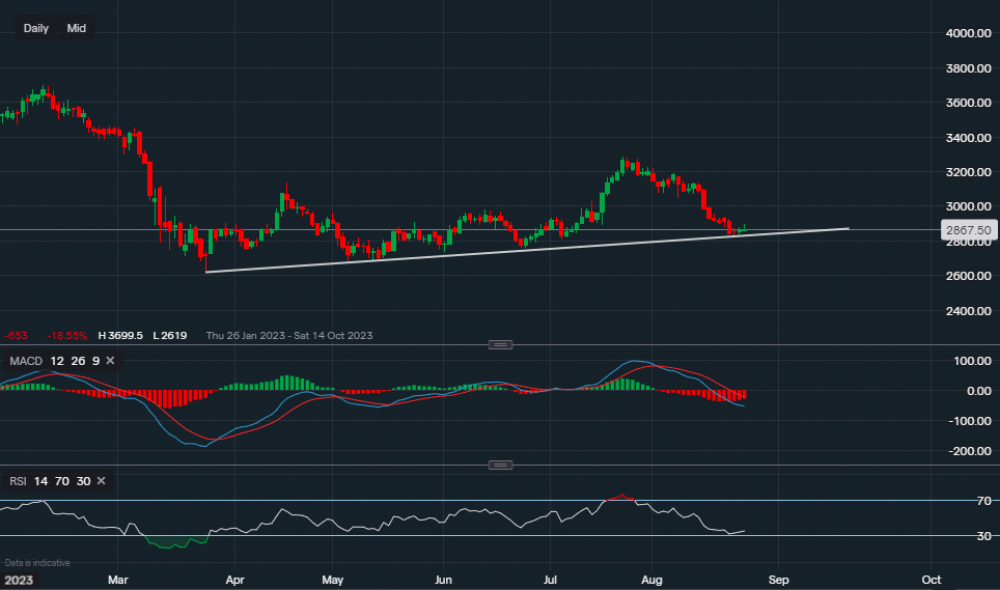
Chart & Data from IG
Bank of America’s stock is currently trading at around $28.67 a share. Looking at the daily timeframe, we can see that its price has now approached a key level of support, which sits along the trendline at $28.23. A break below this price level and a close below the trendline could suggest that a further bearish move is in motion. However, there still are further support levels below that would need to be tested before this would be confirmed. $27.90 followed by $26.83 and then $26.19. A move below $26.10 would be the confirmation of a medium-longer term bearish trend. Regarding the upside, we would prefer to see some consolidation along the trendline before looking at any resistance levels. The resistance levels if consolidation occurred around current levels are as follows: $29.00 then $29.41 and then $29.63. A break and close above $29.63 could be an indication that the continuation of higher lows and higher highs is still in play, and a push higher towards $31-$31.50 would be more likely. The technical indicators remain bearish as the MACD is still strongly in the red and the RSI reading is 33.

Tradable assets:
Min.Deposit:
Max Leverage:
FCA:

Rating:


