Test- FTSE 100 Kicks Off August on a High as BP and Senior Lead Market Momentum
$11
10 Oct 2025, 13:13
Neutral
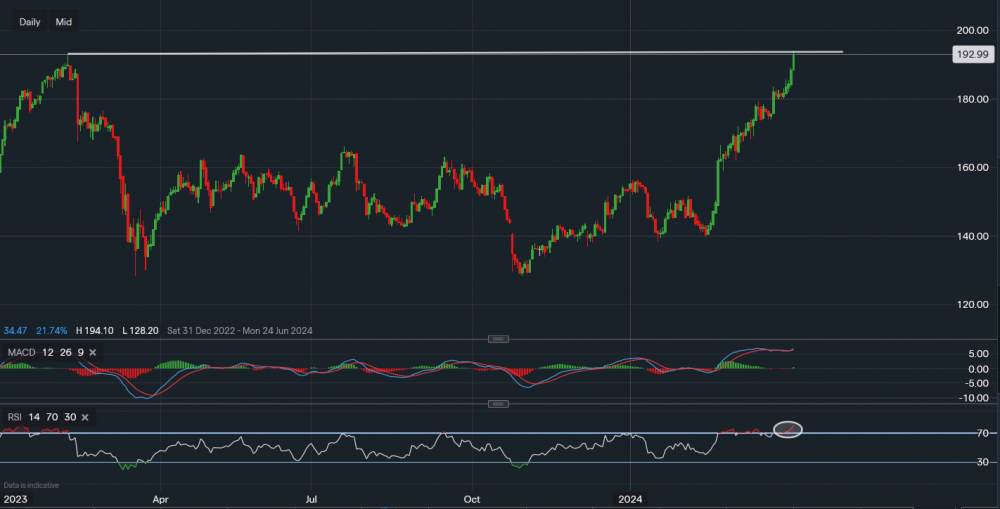
Chart & Data from IG
Taking a look at Barclays here as its stock price has approached a key resistance point on the daily chart. The resistance reads 193p, which is also the current price share price of the stock. Therefore, we could see some volatility here over the next few trading days. A close above this resistance would be a bullish indication which would encourage the bulls to target the following resistance area of 200-203p. However, caution should remain as false breakouts and rejections can occur in such circumstances. We can see that the technical indicators suggest that the stock is a little overbought right now, hence, pullbacks should not be ruled out. The volume on the MACD has now lowered and the RSI is reading 80, the highest reading since January. Consequently, support sits at 188p and then at 183p. A break and close below 183p would then shift the attention toward 179p.

Tradable assets:
Min.Deposit:
Max Leverage:
FCA:

Rating:


