Test- FTSE 100 Kicks Off August on a High as BP and Senior Lead Market Momentum
$11
10 Oct 2025, 13:13
Neutral
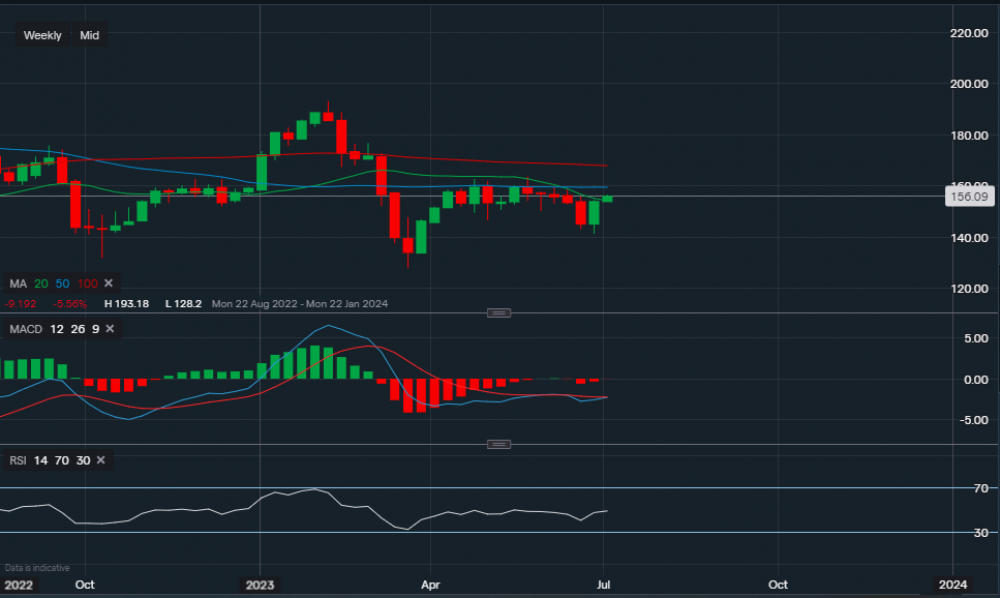
Chart & Data from IG
Barclays seems like it may have found some support around 141p after falling for 5 consecutive weeks. Now trading at around 156p a share, it has moved above the 20-day moving average. The next level of resistance sits at 159p (50-day MA) and then at 167p (100-day MA). The 167p resistance will be a tough level to overcome with the UK leaning more towards a recession, in theory, a recession may have a negative impact on all UK stocks. The severity of the recession (if it happens) is unknown. The support for Barclays rests at the previous level of resistance along the 20-day MA, or respectively, 154p. Which is now acting as support. A move and close below it could see a slide lower towards the support levels sitting at 146p and then 141p. Looking at the technical indicators, MACD is flat and the RSI is neutral as it reads 49.

Tradable assets:
Min.Deposit:
Max Leverage:
FCA:

Rating:


