Test- FTSE 100 Kicks Off August on a High as BP and Senior Lead Market Momentum
$11
10 Oct 2025, 13:13
Neutral
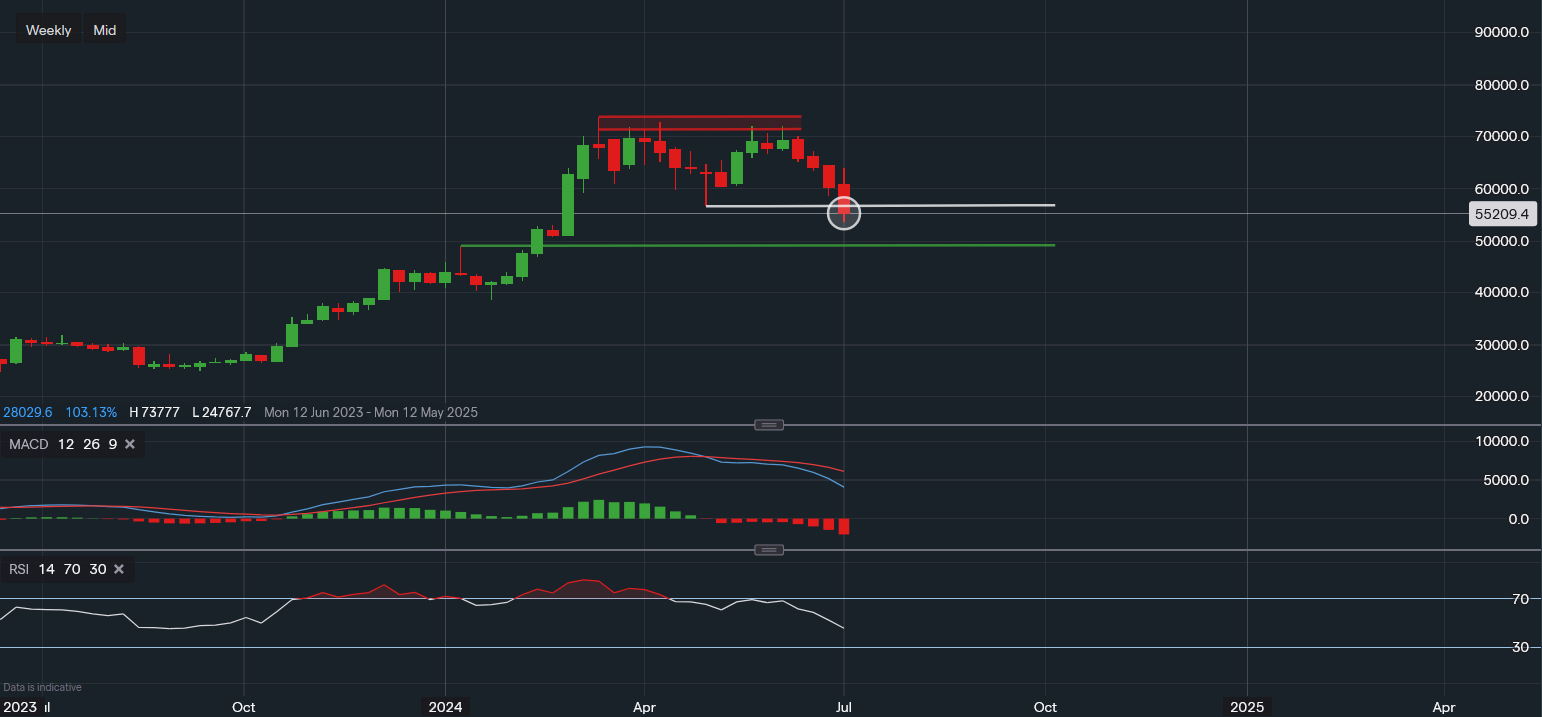
Chart & Data from IG
The price of Bitcoin seems like it is breaking below a key support level, creating concerns for a larger sell-off in the near term. After forming what seems like a double top around between $72-$73k, it is now breaking below the support of $56,566 (white trendline) but it's yet to close below it for the week. Currently, the market is trading at around $55,209 a coin and is down more than 5% on the day. A close below the support of $56,566 for the week would be taken as a bearish indication, raising the likelihood of a move lower toward the support around the January high of $48,984 (green trendline). As the sentiment has now clearly shifted to a bearish approach, it would be unreasonable to outline any resistance levels until some signs of consolidation are present, Looking at the technical indicators, they are very much so in favour of the bears for the time being. The MACD volume is enlarging and the RSI decline is steepening. The RSI just holding onto its neutral positioning as it reads 46, a reading of 44 or lower can usually be interpreted as a bearish signal. But does not guarantee further declines as it's a lagging indicator

Tradable assets:
Min.Deposit:
Max Leverage:
FCA:

Rating:


