Test- FTSE 100 Kicks Off August on a High as BP and Senior Lead Market Momentum
$11
10 Oct 2025, 13:13
Neutral
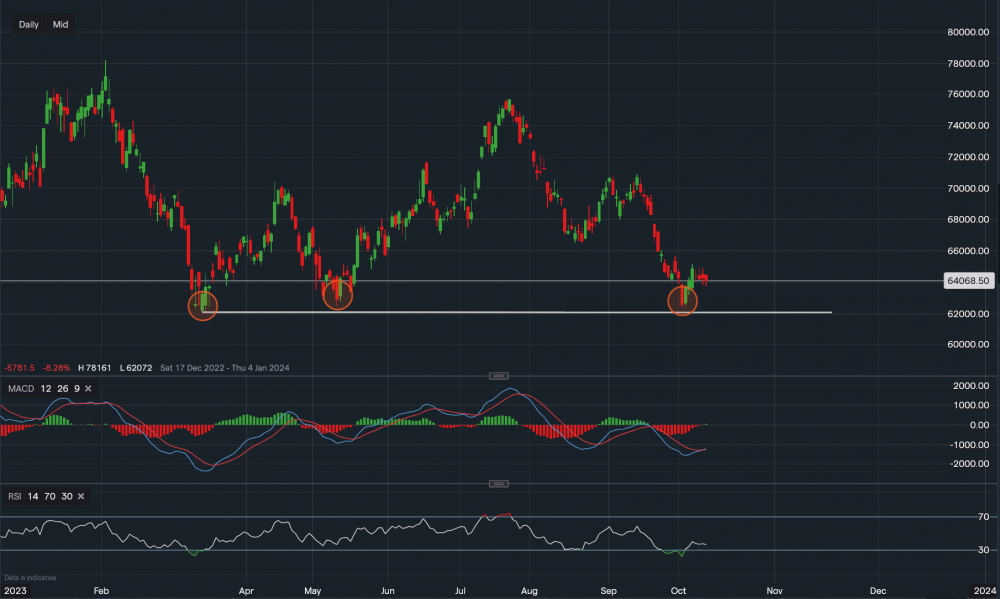
Chart & Data from IG
Taking a look at BlackRock as the investment firm is also scheduled to report earnings tomorrow. Currently, its shares are trading at around $640.68 a share. The white trendline highlights the support base within the timeframe on the chart, and the price has fallen close to it on two occasions but has managed to close above it followed by a bounce. Perhaps this indicates the strength of this current key support area, a break below it would need to test the trendline support of $620.72 before any further moves are considered. The price of BlackRock’s stock has been moving sideways for the past few days with no clear direction, clearly keeping steady ahead of the earnings call. Towards the upside, there is resistance at $649.35 followed by $651.41. A break above $651.41 could see a rise higher towards $656.72. If we look over to the technical indicators at the bottom of the chart, the bias is moderately neutral. The MACD line has only just moved above the signal line whereas the RSI is faltering as it reads 37. The earnings report will be a major influence on the short to mid term outlook for this stock.

Tradable assets:
Min.Deposit:
Max Leverage:
FCA:

Rating:


