Test- FTSE 100 Kicks Off August on a High as BP and Senior Lead Market Momentum
$11
10 Oct 2025, 13:13
Neutral
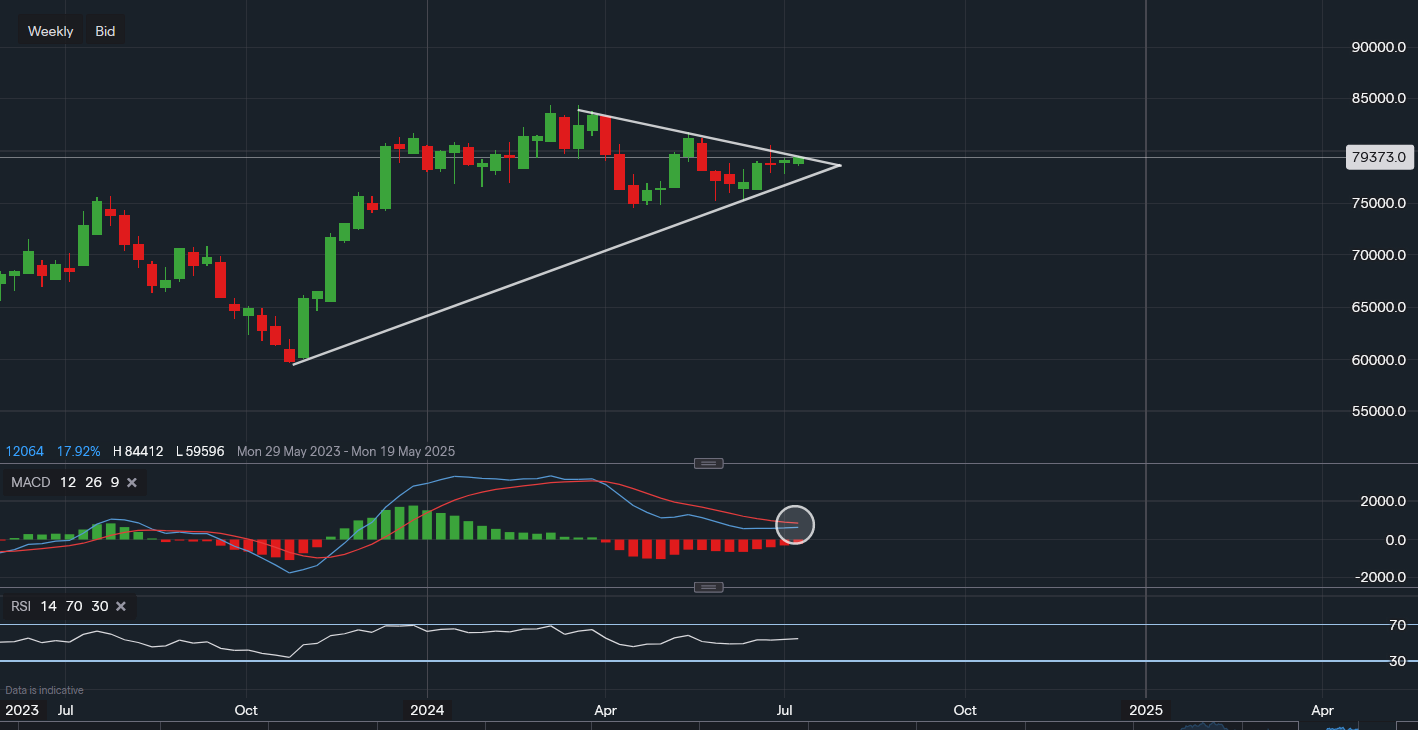
Chart & Data from IG
BlackRock is shaping up on the weekly chart for a potential breakout higher, however, caution should remain as one attempt was already rejected. Currently, its stock is trading at around $793.73 a share. Trendline resistance is now only an inch away, reading $794.58. A break and close above the trendline would in theory be a bullish indication, but investors would require a move above $805.50 to increase their confidence in the near term. Support still remains within the triangle pattern, with the first level at $773.53 followed by trendline support around $770 (lower trendline). A move beyond the lower trendline could see a re-test of the recently established support between $745-$752. The technical indicators are now starting to loo more optimistic again after turning bearish back in April. The MACD volume has lowered and the MACD line is edging closer to its signal line, perhaps it may move above it in the weeks to come. In addition, the RSI is almost positive once again as it reads 54.

Tradable assets:
Min.Deposit:
Max Leverage:
FCA:

Rating:


