Test- FTSE 100 Kicks Off August on a High as BP and Senior Lead Market Momentum
$11
10 Oct 2025, 13:13
Neutral
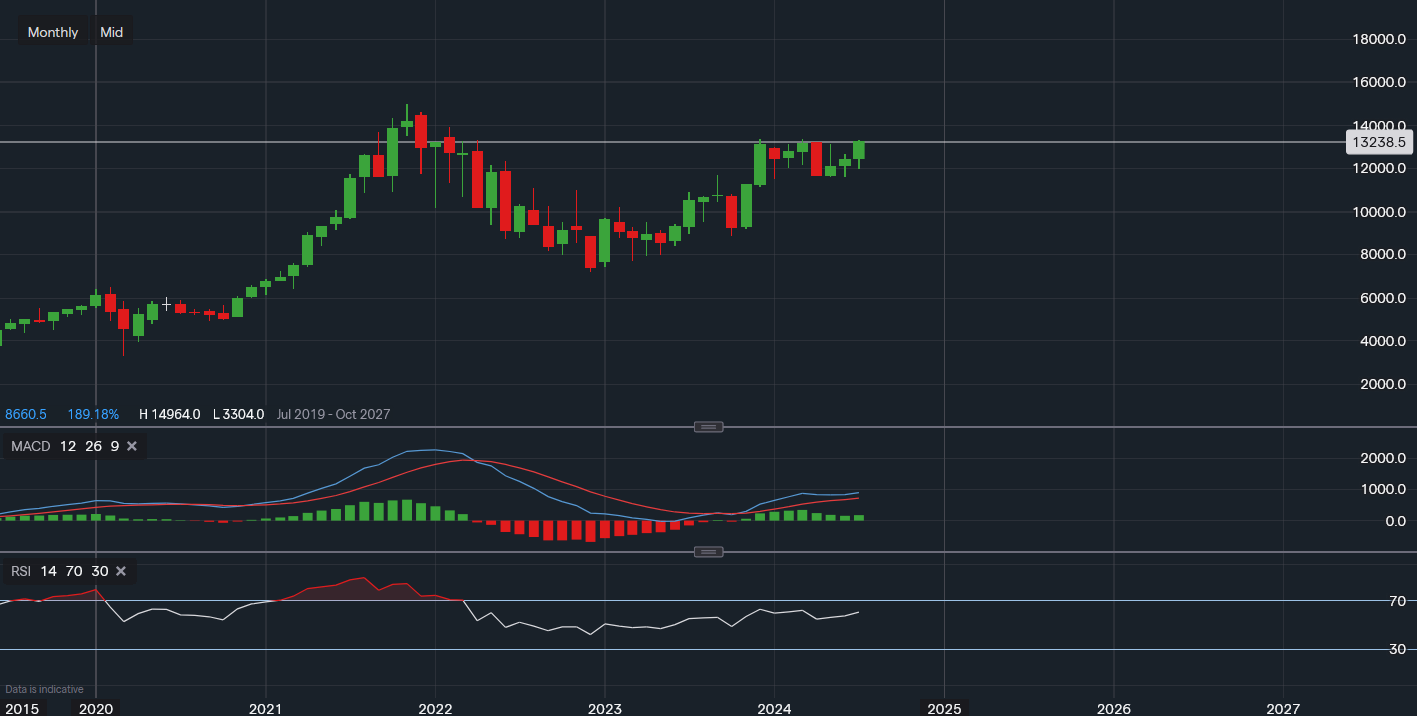
Chart & Data from IG
Blackstone Group is looking rather positive on the monthly chart for a potential move to all-time highs, perhaps testing the resistance around $149.64. Yesterday, its shares closed the day at around $132.38 a share. $133.52 is now the next price level in focus where resistance may be found, failure to move above this point may see the stock rangebound giving the sellers a little more control in the short-term. However, the bulls certainly have the advantage for the time being, The support that investors need to sustain is the area of $115-$116. Any falls below here are likely to cause some concerns as the risk for a sell-off towards October lows ($88-$89) would be heightened. The technical indicators suggest that the bullish momentum is still present, the MACD is positive and rising, it's not yet overbought. Also, the RSI is positive and rising as it reads 60.

Tradable assets:
Min.Deposit:
Max Leverage:
FCA:

Rating:


