Test- FTSE 100 Kicks Off August on a High as BP and Senior Lead Market Momentum
$11
10 Oct 2025, 13:13
Neutral
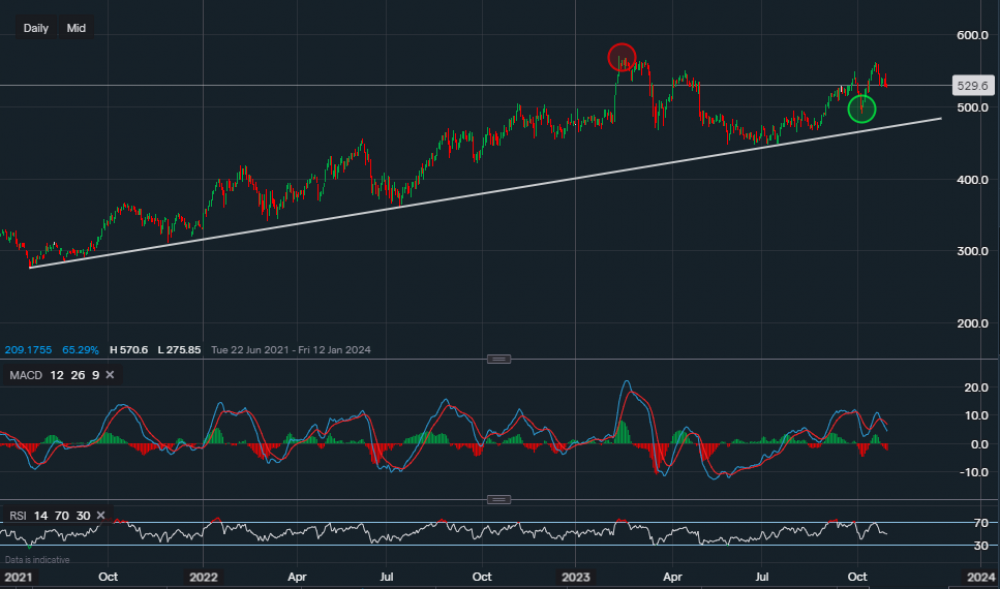
Chart & Data from IG
Taking a look at BP as the earnings season continues, currently, its shares are trading at around 529p a share. From a technical standpoint, we can see that long-term support is still in place and dates back to the 21st of July 2021. Its price came close to testing the support along the trendline back in July of this year but managed to consolidate and close just above it at 449p. The resistance of 551p was a barrier as on the first break attempt there was a rejection, as a result, the price retraced creating the most recent support level of 489p (green oval). It could also be argued that this can be now classed as a new higher low for the short-term outlook, as following this support formation, the price broke above the resistance of 551p closing at 562p. Suggesting that this is the new higher high. It is now undergoing another retracement following the rise above the previous tough resistance. A positive earnings report may result in some consolidation, in turn creating yet another higher low. This then could present the opportunity for a push higher towards the most recent resistance of 562p. A break and close above 562p may see an extension towards February’s high of 570p (red oval). The key support now is the initial higher low of 489p, a break below it could see a pullback towards the trendline support of 478p. The technical indicators are mixed but with a bias more towards the downside as the MACD is negative, but the RSI reads 49.

Tradable assets:
Min.Deposit:
Max Leverage:
FCA:

Rating:


