Test- FTSE 100 Kicks Off August on a High as BP and Senior Lead Market Momentum
$11
10 Oct 2025, 13:13
Neutral
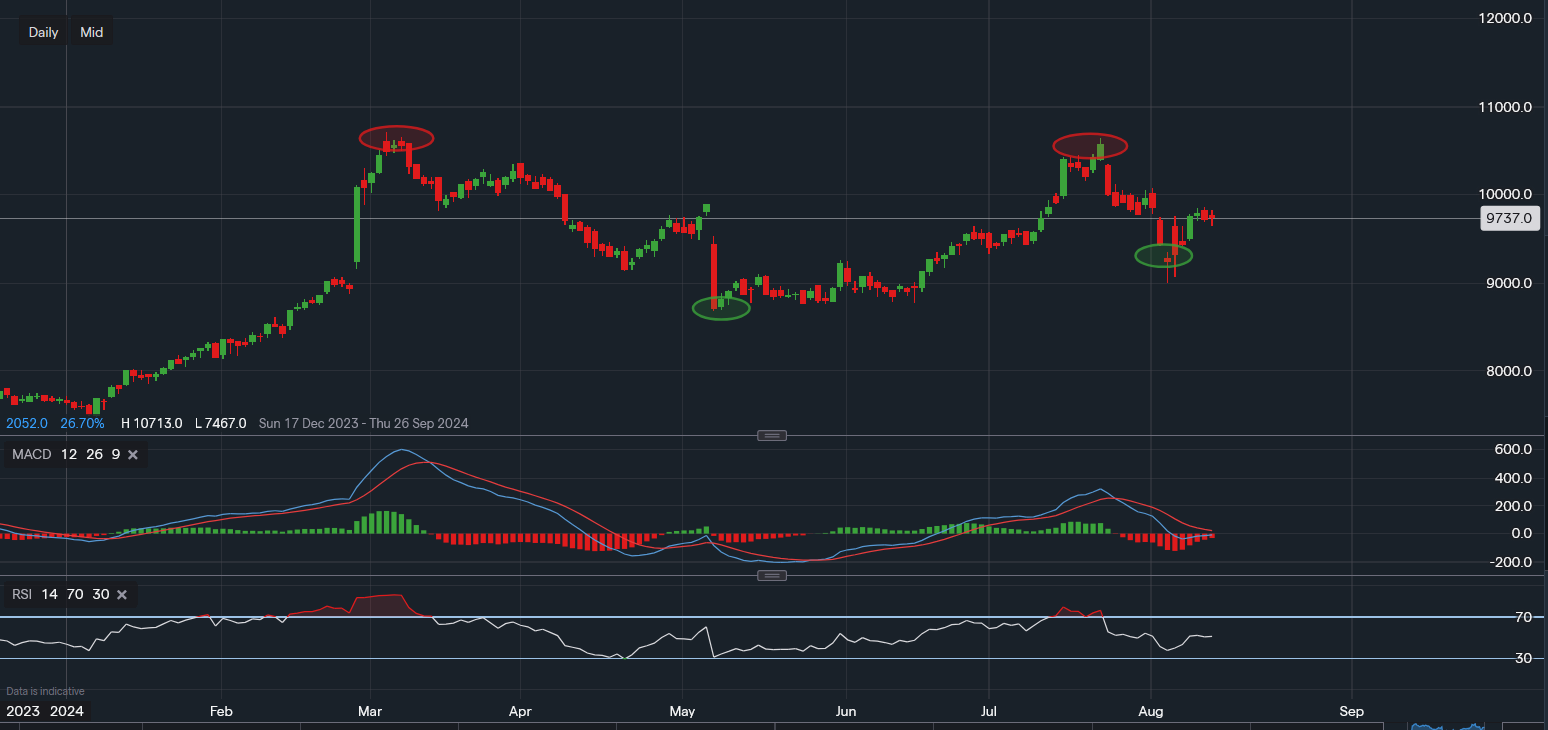
Chart & Data from IG
The daily chart shows us that a double-top occurred on July 23rd, which is known as a bearish indication leading to a fall in the stock’s price. The share price of BWX fell from a high of $104 to the current price level of $97.37, it seems like a new low has been formed for the time being around $89.92 but it is yet to be determined in what direction the price will head towards in the near-term. The longer-term trend remains arguably bullish, especially with the possibly new higher low. However, the double top poses a risk and it is too early to gauge near-term movement. Towards the upside, a move above $98.88 would lower the risk of further downside as it would indicate upside momentum is still present. This would allow investors to position themselves for a potential move back towards all-time highs. On the other hand, a fall below the low of $89.92 would suggest that momentum is fading, perhaps seeing a re-test of May’s support around $86.74. The technical indicators are seen edging back into bullish territory, however, they are lagging indicators. The MACD is yet to cross its signal line and the RSI is still technical in a neutral area. Hence, caution should remain for the near term.

Tradable assets:
Min.Deposit:
Max Leverage:
FCA:

Rating:


