Test- FTSE 100 Kicks Off August on a High as BP and Senior Lead Market Momentum
$11
10 Oct 2025, 13:13
Neutral
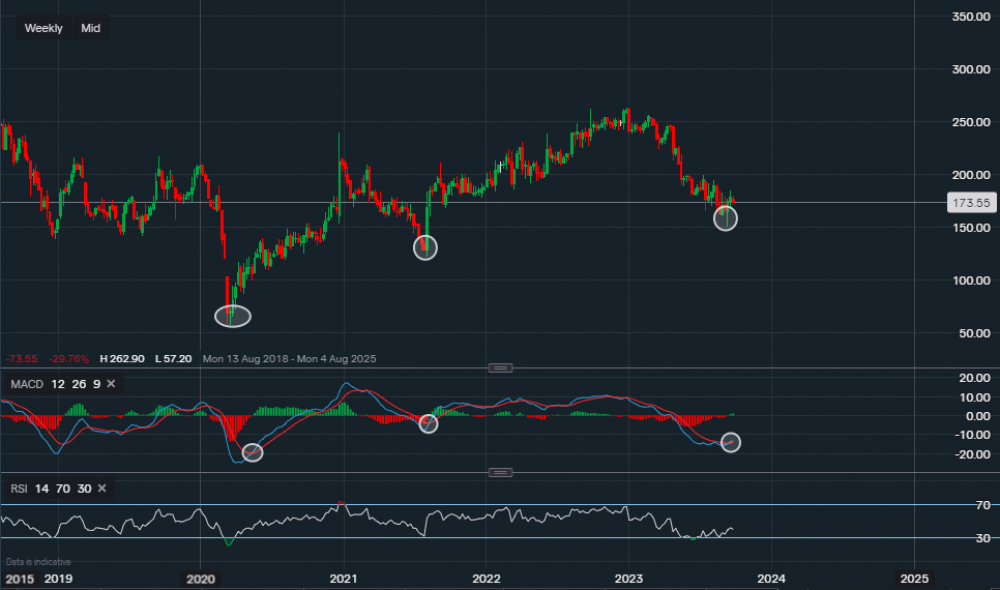
Chart & Data from IG
Financials
In 2022 compared to 2021, revenue quadrupled and gross profit increased 7-fold. The company managed to reduce its operating loss by $15M year-on-year but still reported of total profit (post-tax and other operations) of -$51M. Does this look tragic to the previous total profit in 2021 of $894M? Yes – however, that is only because in 2021 the company received a tax refund of $1,070M, which went down as ‘exceptional income’. This can legally be classified as income and added to the balance sheet. Hence, apart from the one-off tax refund, Capricorn is actually showing signs of gradual growth and improvements within its financial structure of the business. Nevertheless, the reason why Minipip’s opinion on this stock is mixed is due to some weakness within the company’s balance sheet. The company did manage to reduce the value of its total liabilities (positive) but it also reported a smaller value of total assets compared to the prior year, and more substantially when compared to liabilities. As a result, total equity declined by $584M. However, as they are growing and lowering debt and liabilities, a decline in assets is more manageable with room to expand in the future.
Technicals
From a technical perspective, the price and the momentum of the stock suggest that it may continue its longer-term bullish trend. Currently, the price of the stock sits around 173p a share, with what looks like a new key support level of 149p. We can see that the price has been in a downtrend since the start of the year, but signs of a turnaround are starting to show. Simply looking at the history of the chart, we can see a series of higher highs followed by higher lows (higher lows – white ovals on candlesticks). If look deeper into the technicals and focus on the MACD, which is a momentum indicator, we can see that on the last two occasions where the MACD line (blue) crossed above the signal line (red), the price set a higher low which led to a higher high. We can see that the MACD line has just crossed the signal line once more, therefore, this may be an indication of a move higher once again. The RSI is negative for the time being as it reads 39.

Tradable assets:
Min.Deposit:
Max Leverage:
FCA:

Rating:


