Test- FTSE 100 Kicks Off August on a High as BP and Senior Lead Market Momentum
$11
10 Oct 2025, 13:13
Neutral
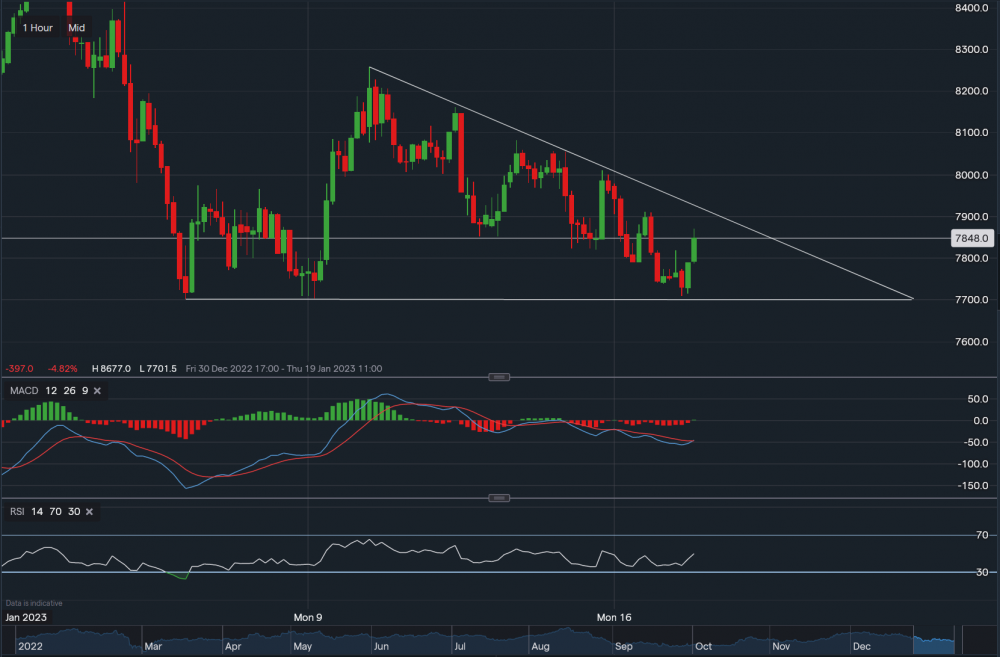
Carbon Emissions - 1 Hour
From a technical aspect, carbon is currently trading at around €78.48. Towards the upside, resistance sits at €78.75 then at €78.88 then at €79.11. A break above €79.11 could create a reversal trend following a bearish week last week. However, at the moment the bias remains bearish. As shown on the 1-hourly timeframe on the chart, carbon is forming a descending triangle. Therefore, support sits at €78.06 then at €77.89 then at €77.40. A dip below €77.40 may see the price of carbon drop towards the key support price level of €77.01. Looking at the technical indicators, MACD is starting to turn positive and RSI is neutral as it reads 50.

Tradable assets:
Min.Deposit:
Max Leverage:
FCA:

Rating:


