Test- FTSE 100 Kicks Off August on a High as BP and Senior Lead Market Momentum
$11
10 Oct 2025, 13:13
Neutral
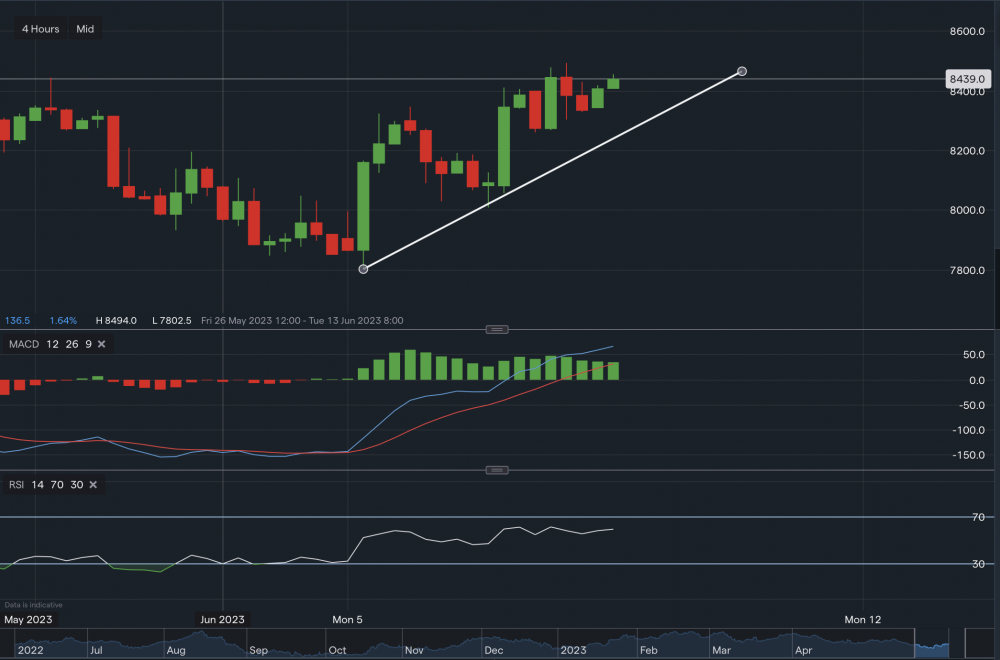
Chart & Data from IG
Carbon remains in the bullish trend, now trading at around €84.39. Looking at the 4 hourly timeframe, we can see that the support is established below along the ascending trendline. At this moment in time, the first level of support below sits at €83.29 (along the trendline). A break below this trendline could see a further retracement towards €82.61, however, this would not necessarily mean that a reversal trend has occurred. Only a break below €80.09 may suggest that a potential reversal in trends has occurred. Towards the upside, minor resistance sits at €84.45 then a tougher point at €84.94. A move above €84.94 could open a pathway towards €86. Looking at the technical indicators, MACD is positive and so is the RSI as it reads 58.

Tradable assets:
Min.Deposit:
Max Leverage:
FCA:

Rating:


