Test- FTSE 100 Kicks Off August on a High as BP and Senior Lead Market Momentum
$11
10 Oct 2025, 13:13
Neutral
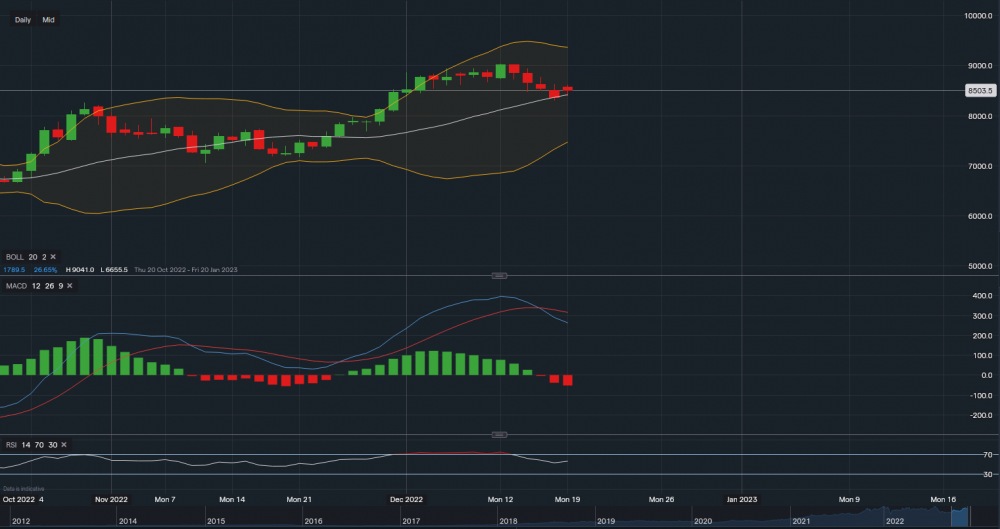
Carbon Emissions - Chart & Data from IG
From a technical outlook, carbon is currently trading at around €85.03. Applying the Bollinger Bands to the chart, carbon has been in a bearish trend since Tuesday 13th of December with support levels now sitting at €84.17 (correspondent with the moving average of the Bollingers) and then at €83.07. A break below the MA of the Bollingers and €83.07 could see the price of carbon fall towards the low 80s. However, if the bullish trend from the back end of October is to continue, resistance sits at €86.12 then at €87.71 then at €88.63. A break above these levels may see the price of carbon head back towards that €90 level seen last week. Looking at the indicators, MACD is currently negative but RSI remains slightly positive as it reads 55.

Tradable assets:
Min.Deposit:
Max Leverage:
FCA:

Rating:


