Test- FTSE 100 Kicks Off August on a High as BP and Senior Lead Market Momentum
$11
10 Oct 2025, 13:13
Neutral
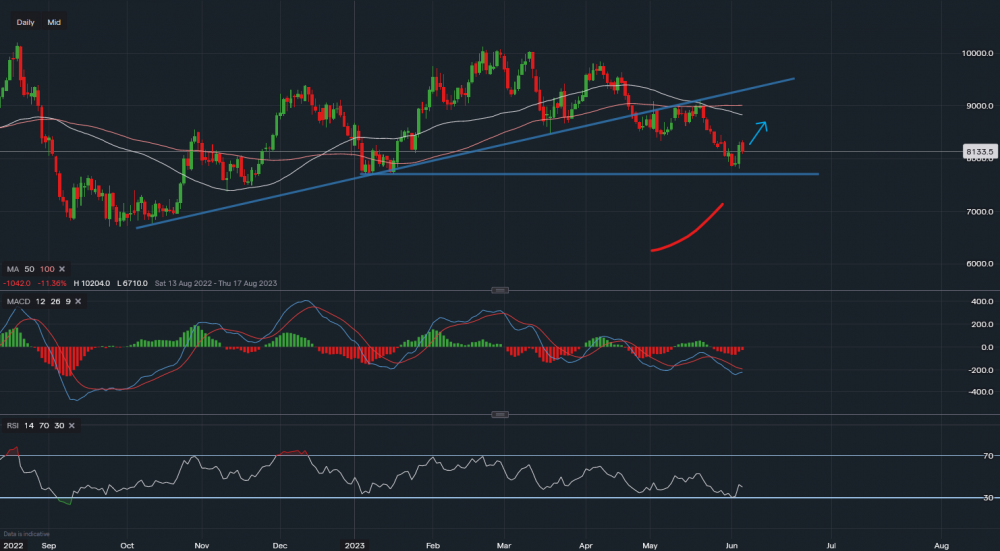
Carbon Emissions - Chart data IG
Carbon Emissions (EU ETS) continues to fall in recent days as gas prices stay muted. Looking at the chart the commodity has support at around €77.00. A break below here could see carbon drop to towards the October cluster at €67.00. MACD is turning higher but still remains negative with RSI reading of 39.
Towards the upside tough resistance sits at €88.41 (50 SMA), followed by €90.00. It could take a few days before the market decides its direction as the recent spike is now facing resistance on the 4-hourly timeframe.

Tradable assets:
Min.Deposit:
Max Leverage:
FCA:

Rating:


