Test- FTSE 100 Kicks Off August on a High as BP and Senior Lead Market Momentum
$11
10 Oct 2025, 13:13
Neutral
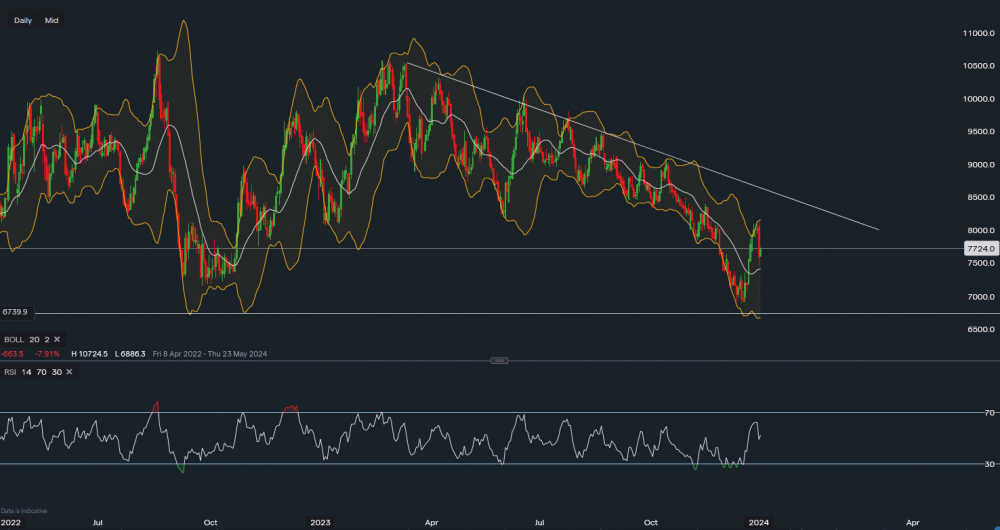
Image data - IG
Since the contract rollover on 15th December, Carbon rallied a whopping 17% to reach 81.20 from 69.00. On the 2nd of January, EUA allowances fell over 5.5% as traders took some profits off the table. Looking at the chart right now, despite the large decline yesterday, for now, carbon still remains in an uptrend. According to the Bollinger Band, support for Carbon sits at 74.17 with a further break below here suggesting a downside towards the 69.00 region and then onto the lower band at 67.30.
Such a move would be noticeable and likely wouldn't just happen in a day unless the market were to become unsettled which right now doesn't look the case. The December rally was strong for many stocks, and assets, therefore it does make sense to see investors and traders take money off the table in January.
Looking towards the upside, carbon does face quite a heavy resistance at 81.30 followed by major trendline resistance at 85.80. A break above here would be very bullish for the token commodity. Carbon is going to be very dependent on CO2 emissions within the EU, so a colder winter or higher GDP could stimulate the price higher and vice versa, a mild winter, or signs of further slowing could hurt the price in the short term.
According to a few sources, Reuters.com analysts do see lower prices in 2024 than initially anticipated at 83.55 on average. which is currently 7.9% below the current price, however for this to actually happen, carbon would also need to trade somewhere in the high 80s to get that average, therefore there could be some good opportunities within 2024 to scope out trades between 70.00 - 85.00.

Tradable assets:
Min.Deposit:
Max Leverage:
FCA:

Rating:


