Test- FTSE 100 Kicks Off August on a High as BP and Senior Lead Market Momentum
$11
10 Oct 2025, 13:13
Neutral
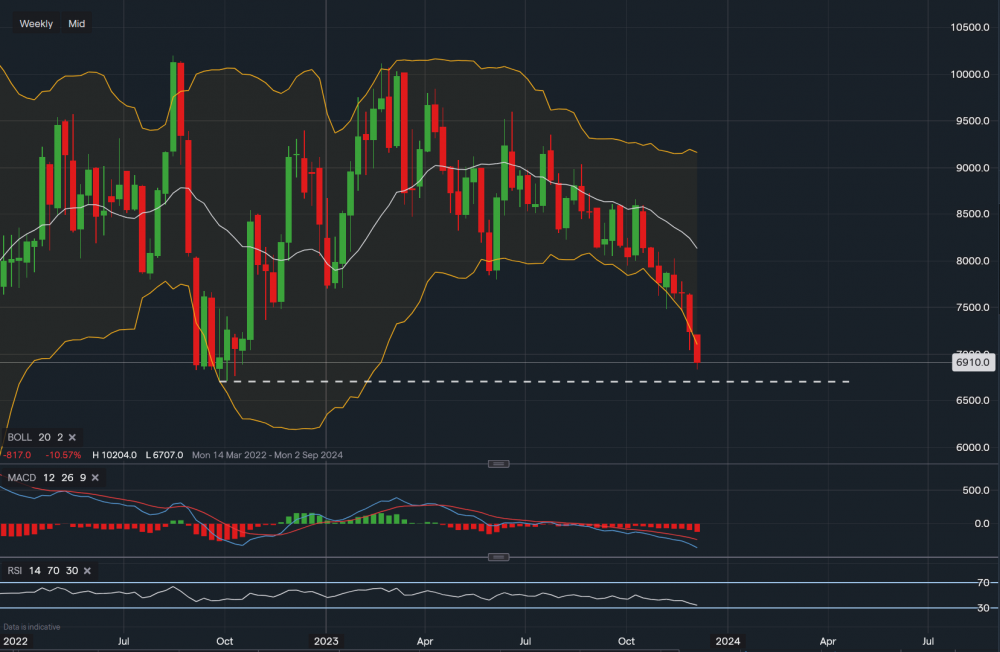
Chart & Data from IG
Taking a look at Carbon Emissions as the commodity is edging closer and closer to oversold conditions. Applying the Bollinger Bands to the weekly chart, we can see that similar time last year when the price reached similar levels a bounce off the lower band occurred. This week’s candlestick is stretching the lower band once again, the key support here is the level of €67.07 (dotted trendline). A break below here would be a bearish indication suggesting that more downside is to follow, perhaps reaching the lows of the Covid pandemic. However, with the market a little oversold we could see a short-term bounce of the band. The resistance here is €72.19, a break and close above it would then allow the bulls to look towards €74.04. Nevertheless, traders and investors should take caution as the technical indicators continue to support the bearish bias and any movement higher is not guaranteed. This is simply a technical comparison to past price action. The MACD is still negative and so is the RSI as it reads 34.

Tradable assets:
Min.Deposit:
Max Leverage:
FCA:

Rating:


