Test- FTSE 100 Kicks Off August on a High as BP and Senior Lead Market Momentum
$11
10 Oct 2025, 13:13
Neutral
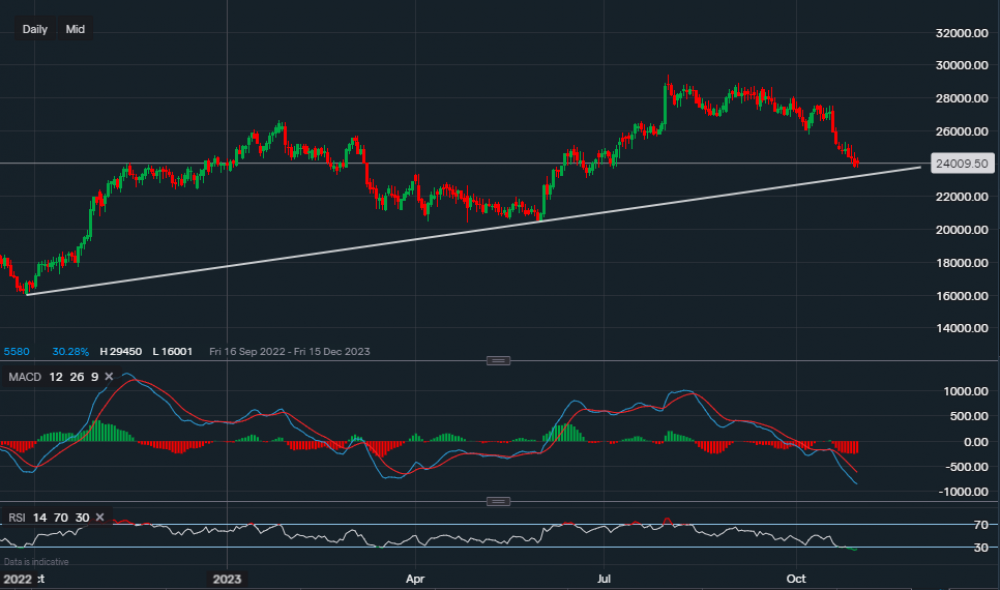
Chart & Data from IG
Caterpillar is scheduled to report its quarterly earnings tomorrow before the US market opens. Looking at the chart based on the daily timeframe, its stock price has been in a downtrend since the 2nd of August. Currently trading at around $240.09 a share, the price has now approached the key trendline support which dates back to September of 2022. We can see that the support upheld in the past as when it was tested back in June, we then saw a big rally creating a new high for the year of $294.50. The support along the trendline reads $232.83, a break below it could see a move lower towards the $220 region. However, this would not necessarily suggest that a new long-term downtrend is in place as there is further support at $205.32. A break below $205.32 would be a stronger indication of a reversal trend regarding the longer-term outlook. A positive earnings report followed by consolidation either around current levels or along the trendline would then allow us to look at potential resistance levels in the upside direction. Current key resistance levels sit at $251.67 then at $257.35. A break above $257.35 could see a push higher towards $265.62. What makes this outlook interesting at this moment in time, is the current position of the technical indicators. The MACD is still rather negative, but the RSI suggests that the stock sits within oversold conditions. The RSI reads 25 and the last time it was in a similar position was back in September, when the initial bullish trend began.

Tradable assets:
Min.Deposit:
Max Leverage:
FCA:

Rating:


