Test- FTSE 100 Kicks Off August on a High as BP and Senior Lead Market Momentum
$11
10 Oct 2025, 13:13
Neutral
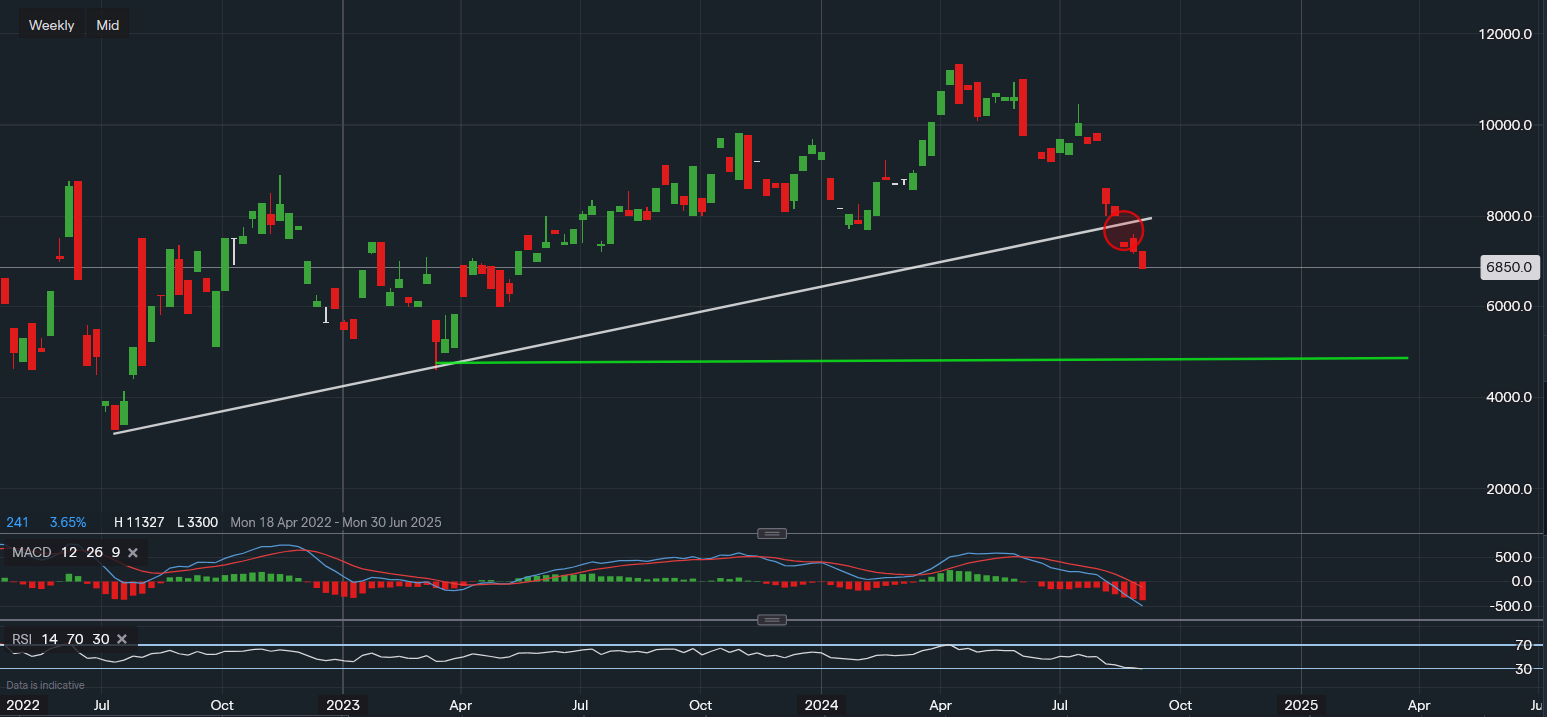
Chart & Data from IG
Chord Energy's share price on the market for $68.60 a share. A clear break below trendline support around $77, shifts the focus to the next support level outlined using the green trendline ($46.11). This should act as the next key support in the short-mid term for this stock, a move below this price level would indicate major weakness and have investors look towards $33 for more support. At that point, investors are likely to look elsewhere for gains. Energy stocks are not as dominant as stocks in other sectors during vulnerable market conditions, creating a higher risk to reward. This could be more of interest to long-term holders if the fundamentals look appealing. In additional, a move towards the green trendline followed by consolidation would offer a greater risk to reward. This view is supported by the positioning of the technical indicators, the MACD is strongly bearish and the RSI reads 29. The RSI has just entered oversold territory but stocks can be oversold for long periods of time with the indicator having no major influence on price action.

Tradable assets:
Min.Deposit:
Max Leverage:
FCA:

Rating:


