Test- FTSE 100 Kicks Off August on a High as BP and Senior Lead Market Momentum
$11
10 Oct 2025, 13:13
Neutral
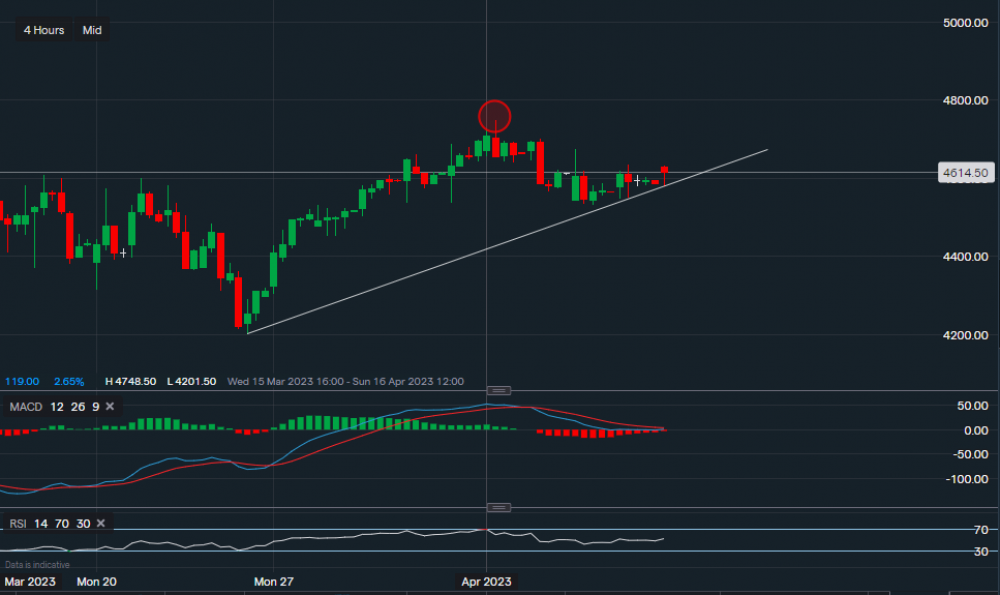
Chart & Data from IG
Similarly to JPMorgan and Wells Fargo, Citigroup is also due to report its quarterly earnings this Friday in the pre-market hours. Looking at the chart we can see that the stock has been in a slight uptrend since the 24th of March, climbing and closing above its previous highs. The price has retraced slightly due to the profit taking but seems like some consolidation has taken place and now there is support along the trendline. Support sits at $45.85 (along the trendline) followed by a key support level sitting at $45.31. A move below the key support may see the stock re-enter the bearish trend and decline once again towards the $42 price. Nevertheless, as the bias remains bullish, resistance sits at $46.35 then at $46.74 then a major level at $47.48 (red oval). A move above the major resistance could see the price edge higher with the target between $49-$50. MACD is neutral with the volume histogram almost flat, and RSI is also neutral as it reads 51.

Tradable assets:
Min.Deposit:
Max Leverage:
FCA:

Rating:


