Test- FTSE 100 Kicks Off August on a High as BP and Senior Lead Market Momentum
$11
10 Oct 2025, 13:13
Neutral
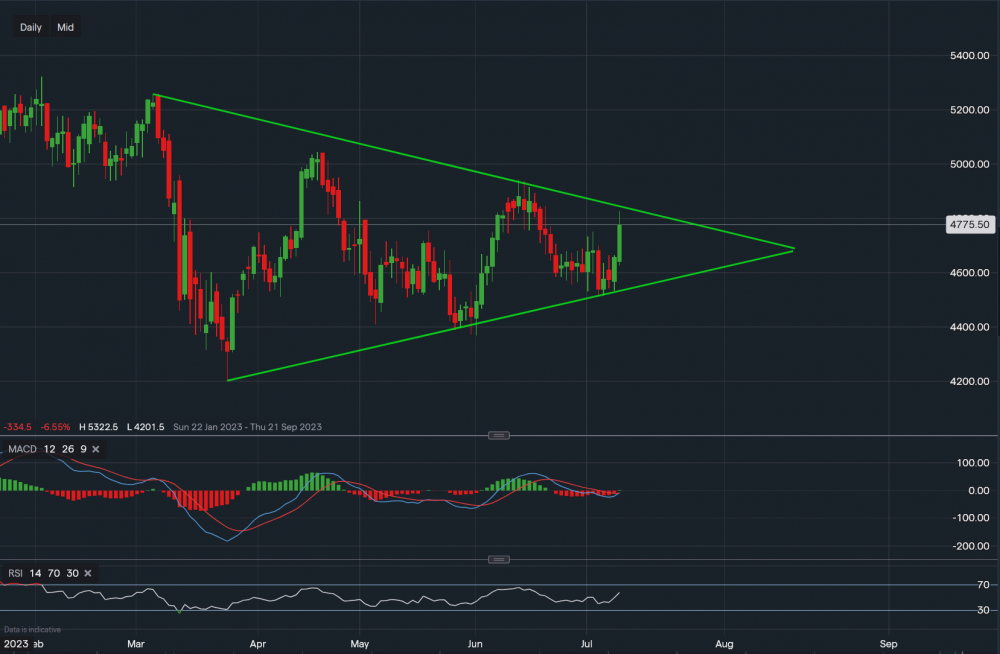
Chart & Data from IG
Taking a look at Citigroup as it is due to report earnings on Friday. The investment bank is expected to report quarterly earnings of $1.37 a share on revenue of $19.59bn. Currently, its shares are trading at around $47.75 a share. Looking at the chart on the daily interval, we can see that the price has been rallying creating a symmetrical triangle. It is now approaching the resistance level of $48.26 after the recent CPI data and the hopes that the Fed will halt its rate hike cycle. If we don’t see a break and close above the upper trendline of the triangle before Friday, then the idea would be that a positive earnings report could bring the momentum for that push higher. In this case, we then would look at resistance levels sitting at $49.41 followed by $50.40. On the other hand, a negative report may just do the exact opposite. As a result, support currently sits at $47.45 (minor) followed by $46.44 and then the key support along the lower trendline at $45.96. A dip below this price level could see a move lower towards $43. 71. Over to the technical indicators, MACD has just turned positive and so is the RSI as it reads 58.

Tradable assets:
Min.Deposit:
Max Leverage:
FCA:

Rating:


