Test- FTSE 100 Kicks Off August on a High as BP and Senior Lead Market Momentum
$11
10 Oct 2025, 13:13

Chart & Data from IG

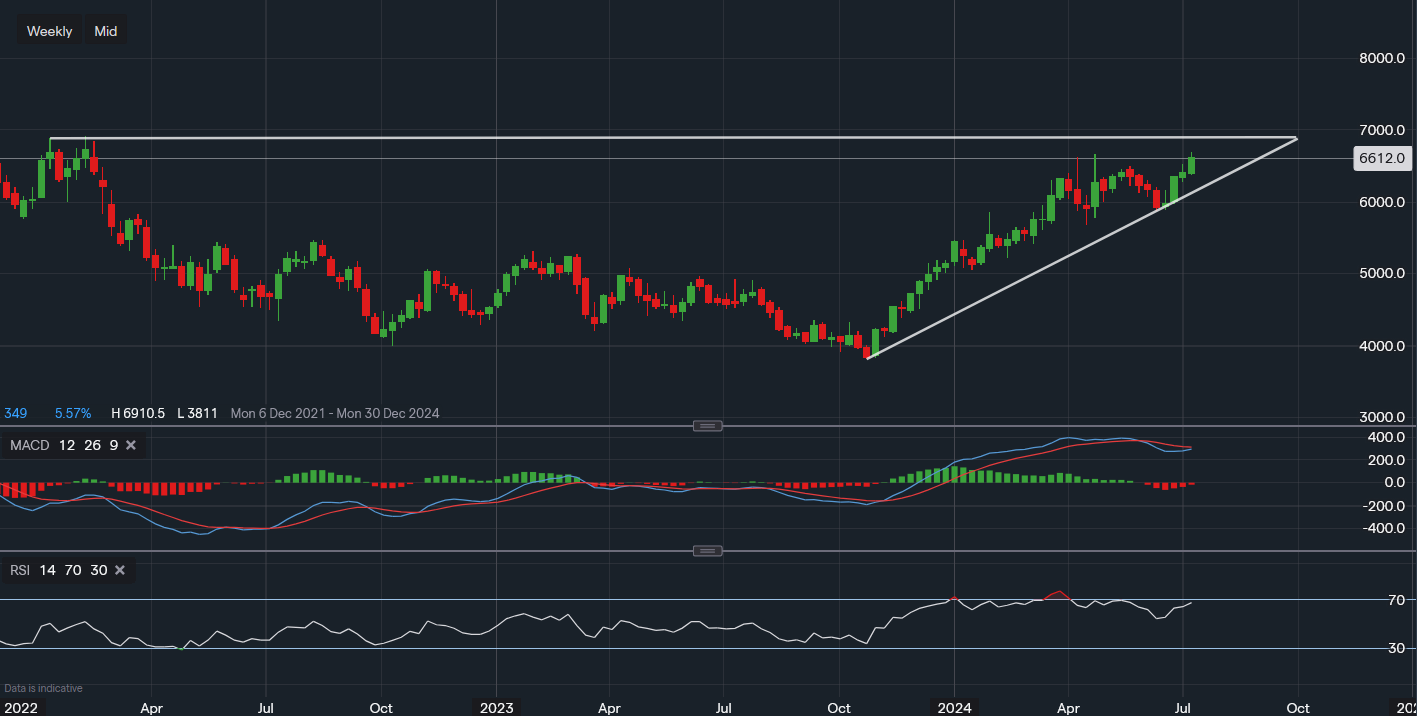
Citigroup’s stock is up 28% year-to-date and up 43% over the last 12 months. As of right now, its shares are trading at around $66.12 a share with what seems like a potential setup to test the resistance around $68.85. There is some minor resistance just at $66.61 which the stock is yet to break through. The earnings may be the catalyst here for a possible breakout attempt, a move above $68-$69 would shift the focus to the area of $74-$80 for the mid-term outlook. Of course, the earnings may have a negative on the price in the near term, hence, the support right now sits along the ascending trendline, reading around $62.00. A dip below the trendline would not be a major concern for investors as levels of $58.86 and $56.73 should also offer support. The technical indicators are fairly similar to those of the other financial institutions that report tomorrow, implying that they are somewhat correlated going into this earnings season. Therefore, the approach here should be the same as with others. Indicators point to further upside but caution should remain as earnings have a bigger influence on price volatility than momentum indicators.