Test- FTSE 100 Kicks Off August on a High as BP and Senior Lead Market Momentum
$11
10 Oct 2025, 13:13
Neutral
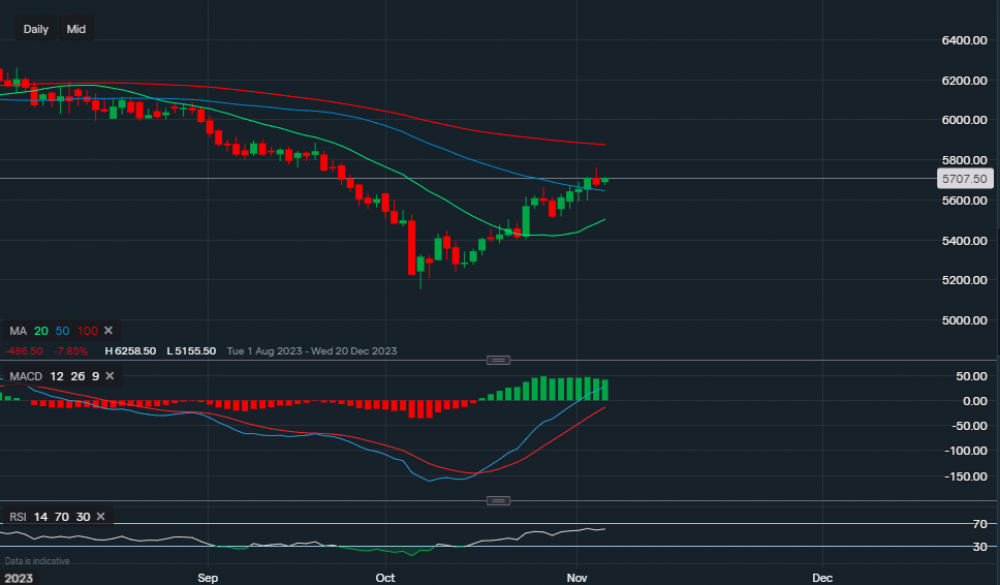
Chart & Data from IG
Taking a look at Coca-Cola as it’s had a nice rise ever since reporting its quarterly earnings. Looking at the chart on the daily timeframe and applying the moving averages, we can see that the price has now climbed above the 50-day moving average. After moving above the 20-day a couple of weeks ago, the price re-tested the MA support leading to an engulfing candlestick on the 24th of October. This provided the momentum for its current level and effort to climb above the 50-MA. The resistance now sits along the 100-day MA, currently reading $58.75. This will be a challenging point for the stock. A clear break and close above the 100-day MA would be a bullish sign, allowing traders/investors to eye up the $60-$61 region. However, this is a near-mid term outlook and it would not be an indication that the stock will continue within its current upside trend for the longer-term outlook. We are still in a long-term bearish trend which began back in May, until this trend is clearly broken, caution should remain. Support for the bulls now sits at along the 50-day MA, which is now reading $56.45. A fall and close below could then see the price re-test the 20-day MA once more, currently reading $55.03. The technical indicators support the present bullish bias as the MACD is strongly positive and the RSI reads 61.

Tradable assets:
Min.Deposit:
Max Leverage:
FCA:

Rating:


