Test- FTSE 100 Kicks Off August on a High as BP and Senior Lead Market Momentum
$11
10 Oct 2025, 13:13
Neutral
Coherent - Chart & Data IG
Overview
The American company Coherent Corp. produces optical materials and semiconductors. The corporation employed 22,961 people as of 2021. Its stock is traded on the New York Stock Exchange under the ticker COHR. Coherent, a maker of lasers, was bought by II-VI in 2022, and the company took on that name.
Financials
Taking a look at the income statement for the year that ended 30th of June 2022, revenue rose to $3.3bn from $3.1bn and gross profit rose to $1.26bn from $1.17bn. However, if we head over to the net income section, there has actually been a decline of $94 year-on-year. This was due to a rise in operating expenses and a loss in non-operating income. EBITDA grew by $27 million but because of the above expenses and losses, earnings per share totalled $1.57 for the year. Down $0.93 from the previous year. Glancing at the balance sheet, cash-on-hand was raised by $1bn and is very strong in comparison to past years, sitting at $2.58bn. Continuously, total assets saw a rise of $1.33bn whereas total liabilities rose $1.12bn. The difference in growth between assets and liabilities was added to the shareholder equity, which now totals $3.6bn compared to $3.4bn in 2021.
Technicals
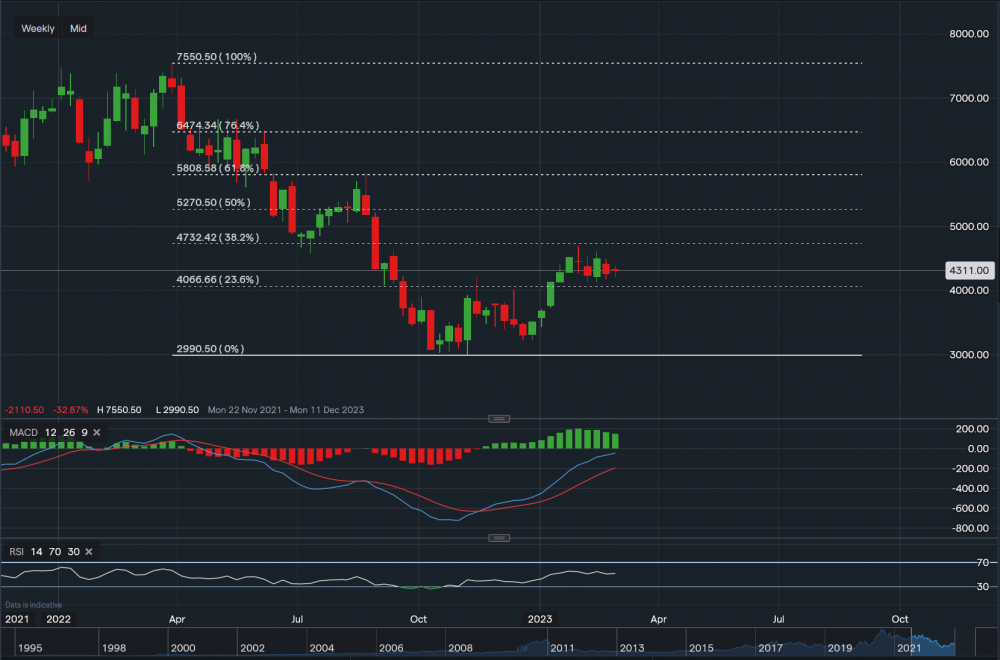
Coherent’s stock closed yesterday’s trading session at $43.11 a share. Applying the Fibonacci retracement to the chart on the weekly timeframe, we can see that support sits at $40.66 (23.6% fib). A break and close below the 23.6% fib could see the price fall further towards the major support resting at $29.90 (0% fib). Although this would be more likely in the longer term and if the company’s performance was weakening gradually. However, we can see that a break out of the bearish trend into the upside has occurred, hence, the bias for the time being remains bullish. Resistance sits at $47.32 (38.2% fib) then at $52.70 (50%) than a major level at $58.08 (61.8% fib). A break above the 61.8% fib would be a huge success for the stock after the heavy losses in 2022, perhaps seeing the price edge even higher towards the $65-$70 price range. This is a longer-term outlook that considers many factors, such as the demand for this stock as well as the performance and earnings of the company. Technical indicators suggest a neutral-positive stance as MACD is positive and RSI is neutral (RSI reads 51).
Summary
Overall, Coherent’s financials are more positive than negative. As shown above, the balance sheet demonstrates stability and a higher level of security due to a strong cash-on-hand balance. There is steady growth within revenue and gross profit, suggesting the demand for their products is still there. However, due to higher expenses, they have been less profitable in 2022. This is not the end of the world as the net profits are still greater than they were in the past 5 years (besides 2021 where it was more profitable). So making sure that their expenses don’t overgrow, or are limited, will allow the firm to operate at a higher profit (like the past two fiscal years) when compared to the past decade. Technicals suggest the bias remains positive (bullish) and support is established below. Until the 23.6% fib is broken, the outlook of this stock is neutral-bullish.

Tradable assets:
Min.Deposit:
Max Leverage:
FCA:

Rating:


