Test- FTSE 100 Kicks Off August on a High as BP and Senior Lead Market Momentum
$11
10 Oct 2025, 13:13
Neutral
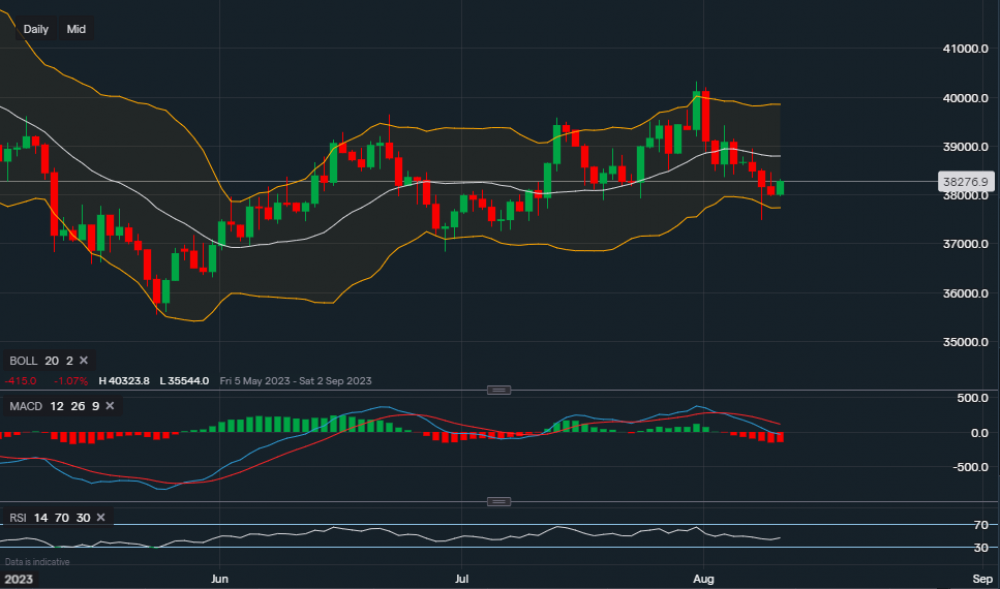
Chart & Data from IG
Taking a look at copper as it has now approached the lower Bollinger Band on the daily interval. Currently trading at around $3.8276. We can see that since the 25th of May, the commodity has been setting higher highs and higher lows within the Bollinger bands. A close today above yesterday’s low of $3.8008 would confirm another higher low, creating the potential for a bounce back towards the middle moving average of the Bollinger Bands. Support currently sits at $3.7971 and then at $3.7731 (lower Bollinger). A break below the lower Bollinger could see the price move lower towards $3.7256. Towards the upside, resistance sits at $3.8465 and then at $3.8793 (middle band). A break above the middle Bollinger may see a continuation of this trend back up to the upper Bollinger, although this would have to be analysed at the time. Looking at the technical indicators, MACD is currently negative but RSI is neutral as it reads 46.

Tradable assets:
Min.Deposit:
Max Leverage:
FCA:

Rating:


